Translate this page into:
Role of computed tomography and chest radiography in imaging of Impella heart pump and associated complications

*Corresponding author: Timothy Hoang, Department of Imaging Sciences, University of Rochester Medical Center, Rochester, New York, United States. timothy_hoang@urmc.rochester.edu
-
Received: ,
Accepted: ,
How to cite this article: Hoang T, Baran TM, Marinescu M, Mandalapu A, Chaturvedi A. Role of computed tomography and chest radiography in imaging of Impella heart pump and associated complications. J Clin Imaging Sci. 2025;15:14. doi: 10.25259/JCIS_130_2024
Abstract
Objectives
The objectives of the study are to identify usefulness of chest radiography (CXR) and computed tomography (CT) for the assessment of optimal Impella positioning compared to echocardiography.
Material and Methods
In this retrospective study, records of 500 patients were reviewed, 95 subjects met the inclusion criteria. The distance from the carina, top of the aortic arch, and in case of CT, from the aortic valve plane to the Impella inlet port was measured. Subjects were stratified into two groups based on echocardiography: Those that did require repositioning and those that did not.
Results
CT revealed greater distance from the carina to the aortic valve plane in patients requiring Impella repositioning compared to those which did not (81.6 ± 15.9 mm vs. 67 ± 13.2 mm, P = 0.019). The distance from the aortic valve plane to the Impella inlet was shorter in repositioned cases on CT (22.3 ± 28.6 mm vs. 35.8 ± 13.3 mm, P = 0.045). The expected location of the aortic valve plane was 6.8 ± 1.3 cm from the carina among CT cases, representing a useful measurement for evaluation on CXR. Significant predictors of aortic valve plane to carina distance on CT were found to be aortic arch to Impella outlet on CXR (P < 0.0001) and carina to Impella outlet on CXR (P < 0.0001).
Conclusions
CT imaging correctly identified patients that required repositioning on echocardiography. Key CT measurements serve as crucial indicators for repositioning and there is notable agreement on measurements across CXR and CT as well as CT and echocardiography in identification of Impella high or low positioning. In addition, there is evidence of significant predictors of CT measurements from CXR.
Keywords
Cardiac
computed tomography
echocardiography
impella
radiography

INTRODUCTION
The Impella is a percutaneous catheter-based ventricular assist device used for temporary hemodynamic support in patients with ongoing cardiogenic shock (CS). Impella is used to treat CS that is not responsive to medical management.[1-4] There are other forms of mechanical support for CS; however, the Impella’s relative ease of placement and favorable hemodynamic effects make it a popular option.[5-8] The device is typically placed into the left ventricle through a peripheral arterial sheath placed in the femoral or axillary arteries [Figure 1]. The Impella acts to both reduce left ventricular end-diastolic pressure and increase cardiac output being able to deliver between 2.5 and 5.0 L/min[9-11] of flow depending on the model of device and underlying hemodynamics. These benefits are offset by the risk of complications. Many of these complications arise from Impella mispositioning and include hemolysis, arrhythmia, sudden loss of mechanical support, and damage to cardiac structures.
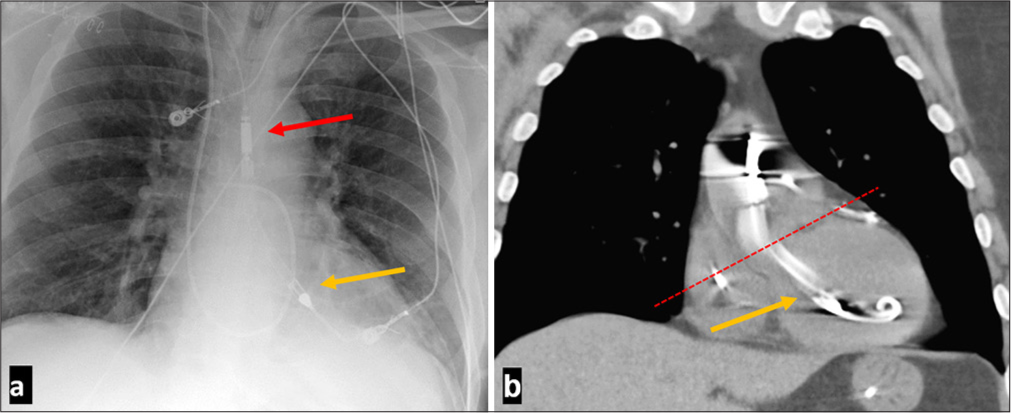
- A 60-year-old male presenting with ST-elevation myocardial infarction with left anterior descending occlusion placed on Impella support for cardiogenic shock support with normal Impella positioning. (a) Frontal anteroposterior chest radiograph demonstrating normal positioning of Impella with red arrow marking the Impella outlet and yellow arrow marking the Impella port. (b) Coronal computed tomaography without contrast showing normal Impella positioning. Impella Cardiac Power inlet port indicated by the yellow arrow is about 35 mm from the aortic valve plane indicated by the red dashed line. For Impella 5.5 the inlet port should be 50 mm below the aortic valve plane.
Optimal positioning of the Impella device in patients is predominately evaluated by echocardiography.[12] Optimal positioning is defined by the distance of the inlet port below the aortic valve plane. The optimal distance depends on the model of the Impella (35 mm for Impella 2.5, Impella Cardiac Power [CP], and Impella 5.0 while 50 mm for Impella 5.5 and Impella Left Direct [LD]).[7,8,13] There are additional anatomical aspects that correspond to optimal positioning. The distal tip of the Impella should be oriented toward the apex of the left ventricle.[14] The pigtail portion or the inlet should not be tangled in the mitral valve apparatus. Transthoracic echocardiography (TTE) in the parasternal long axis view is the imaging modality preferred in ensuring correct Impella positioning; however, up to 30% of intensive care units (ICU) patients do not have adequate acoustic windows on TTE, predominantly due to lung pathology, prior sternotomy, or distention during mechanical ventilation.[14,15]
Chest radiography (CXR) and chest computed tomography (CT) are often obtained in these ICU patients to evaluate for cardiopulmonary diseases, lines, and tubes. However, there are no studies that seek to define the optimal landmarks that might be used to identify malposition of the Impella devices on CXR. Because the aortic valve plane cannot be viewed on CXR, previous studies investigating the utility of supine CXRs in Impella positioning assessment have also only computed ratios to estimate the location of the aortic valve plane.[15]
The increasing utilization of MSC for the treatment of CS and heart failure suggest a need for more easily obtainable diagnostic studies for Impella positioning. The purpose of this study was to identify how imaging modalities such as CXR and CT can be used in the evaluation of Impella device position, malposition, and any associated complications.[16,17]
MATERIAL AND METHODS
Study design and conduct
This is a single-center retrospective study. Institutional review board approval was obtained to identify patients who had undergone Impella implantation. We requested both a waiver of consent and health insurance portability and accountability act (HIPAA) authorization to allow access to identifying these potential research subjects. We utilized that the radiology information system to identify subjects who have undergone CXR, CT, and echocardiography within 48 h after placement and before any further adjustment of the device was documented. There were 500 subjects in the 8-year periods who had this device implanted. Patient’s electronic medical records were assessed to note findings at the time of the cardiovascular intervention. Each patient was given anonymity by assigning a subject ID number which was associated with the report text document for recordings.
Inclusion criteria
Males and females aged 18–90 years who had the Impella support device
CT and echocardiography performed within 48 h.
Exclusion criteria
Suboptimal image quality (including significant motion artifact, inappropriate positioning, and/or low resolution to hinder visualization of anatomic structures assessed in this study).
95 subjects met the inclusion criteria for this study. Table 1 describes the demographics of the final cohort included in this study. Indications for each study and the imaging findings were recorded. The CXR obtained were supine portable bedside anteroposterior single views (CXR anterior-posterior [AP]). All the CT scans were performed on a 64 slice helical CT scanner. In 87 subjects, CT was obtained without intravenous contrast. In 8 subjects, CT was obtained after intravenous injection. Contrast-enhanced CT images were obtained 60 s after standard dose of 1 mL/ kg of iodinated 350 mg/mL intravenous contrast media administered at 2 cc/s. CT angiography for pulmonary arteries or thoracic aorta was performed using bolus tracking with dose of 1–1.5 mL/kg of iodinated 350 mg/mL intravenous contrast was administered at 4 cc/s. None of these studies were obtained using electrocardiogram (ECG) gating.
| Measure | Summary | Repositioned (n=12) | Not Repositioned (n=83) | P-value* | Optimally positioned (n=60) |
Not optimally positioned (n=35) |
P-value† |
|---|---|---|---|---|---|---|---|
| Age | 58.9±13.8 | 62.1±10.6 | 58.4±14.2 | P=0.39 | 57.5±14.4 | 61.2±12.6 | P=0.22 |
| Sex (% male) |
n=75/95 (78.9% [69.4–86.6%]) |
n=9/12 (75% [42.8–94.5%]) |
n=66/83 (79.5% [69.2–87.6%]) |
P=0.71 |
n=47/60 (78.3% [65.8–87.9%]) |
n=28/35 (80% [63.1–91.6%]) |
P>0.99 |
| BMI | 32.3±6.07 | 35.3±7.02 | 31.8±5.77 | P=0.064 | 31.4±5.43 | 33.7±6.82 | P=0.1 |
| Height (m) | 1.74±0.0969 | 1.72±0.1 | 1.74±0.0968 | P=0.54 | 1.74±0.0919 | 1.74±0.106 | P=0.93 |
| Weight (kg) | 97.6±20.7 | 104±19.2 | 96.4±20.8 | P=0.21 | 95.5±20.9 | 101±20.1 | P=0.25 |
Demographics were not reported for all subjects, so denominators reflect subjects for which each measure was reported. Summaries are n (proportion [95% confidence interval)] for categorical variables and mean±standard deviation for continuous variables. P values for comparison between repositioned and not repositioned are results of Fisher’s exact test for categorical variables and unpaired t-tests for continuous variables. *Repositioned versus not repositioned. †Optimally positioned versus sub-optimally positioned. BMI: Body mass index
Image analysis
All images were evaluated by a board-certified radiologist with cardiothoracic fellowship training. An initial random set of 25 CT and CXR cases was used to train a 3rd-year medical student on how to obtain these measurements. The medical student performed all these measures independently while reviewing them with the board-certified radiologist. The same procedure was done with characterizations of Impella imaging with echocardiograms. All echocardiograms were evaluated by a board-certified cardiologist. An initial random set of 35 cases were used to train the same medical student on how to characterize depth and rotation of Impella devices. The medical student again performed all these measurements independently while reviewing them with the board-certified cardiologist. The following measurements were obtained:
CXR
All CXR images were evaluated using commercially available picture archiving and communication system (Phillips Intellispace Portal version 8.0, Phillips, The Netherlands). The following measurements were obtained: Top of aortic arch to carina, top of aortic arch to Impella outlet, carina to Impella outlet, and angle of inlet and outlet of Impella [Supplementary Figure 1].
CT
CT image analysis was performed using a dedicated 3D workstation (Philips Intellispace Portal). Coronal and axial views were used to compute distance measurements including: Aortic arch to carina, aortic arch to aortic valve plane, carina to aortic arch, and aortic valve plane to Impella inlet [Supplementary Figures 2 and 3]. Multiplanar reconstruction using CT images were used to calculate central line distances and aortic valve plane to Impella inlet distances [Supplementary Figure 4].
Echocardiography
Echocardiography in the form of transesophageal echocardiogram (TEE) and TTE was used in this study to determine the state of positioning of the Impella device in patients. Each Impella echocardiogram was reviewed and characterized by depth and rotation under the guidance of a cardiologist. In terms of depth, an Impella could be shallow, optimal, or deep. In terms of rotation, an Impella could be mitrally rotated, optimally positioned, or septally rotated. Typically, the need for repositioning of the Impella device was determined in real time by the cardiac intensivist or based on a read of mispositioning on the echo report.
Statistical analysis
Continuous variables are summarized by mean and standard deviation, while categorical measures are summarized by proportion and 95% confidence interval (CI). Fisher’s exact test was used to compare categorical variables, while the unpaired t-test was used to compare continuous variables. Univariate logistic regression was performed with Impella re-positioning or sub-optimal positioning as the outcome, and each imaging measure taken independently as a predictor. Univariate linear regression was used to predict CT measures of aortic valve plane to Impella inlet distance or carina to aortic valve plane distance, with measures on other modalities used as predictors. Multivariable linear regression was then performed, with body mass index (BMI) and height as additional covariates. Agreement between imaging modalities was assessed using the intraclass correlation coefficient (two-way random model for absolute agreement) and Bland–Altman bias. For each of these agreement assessments, P-values were calculated based on a one-sample t-test against a theoretical mean of 0. All statistical analysis was performed in MATLAB (R2019b, The Mathworks, Inc., Natick, MA).
RESULTS
Patient demographics
Of the 95-subject identified, 75 were male and the mean age was 58.9 ± 13.8 years. Mean BMI, height, and weight were 32.3 ± 6.07 kg/m2, 1.74 ± 0.0969 m, and 97.6 ± 20.7 kg, respectively. There were no significant differences in demographics between those that had their Impella device re-positioned and those that did not. There were also no differences in demographics between those with optimal and sub-optimal positioning of the Impella device, as identified on echo [Table 1]. Of the included subjects, 6 had an Impella 2.5 device, 78 had an Impella CP, 6 had an Impella 5.0, and 5 had an Impella 5.5. Subjects with the Impella CP device had non-significant (P = 0.28) lower rates of re-positioning than for those with other Impella types.
Imaging characteristics
Across all subjects, the carina to aortic valve plane distance on CT was 67.8 ± 13.7 mm, and the aortic valve plane to Impella inlet distance was 35 ± 14.7 mm on CT. Distances measured on CT from aortic arch to carina and aortic arch to aortic valve plane were 50.5 ± 10.7 mm and 118 ± 15.8 mm, respectively. Measurements made on CT, the scout image, CXR, and central line were compared between those that did and did not have their Impella device re-positioned [Table 2]. The carina to aortic valve plane distance measured on CT was significantly larger in subjects that had their Impella re-positioned (81.6 ± 15.9 vs. 67 ± 13.2 mm, P = 0.019). As expected, the aortic valve plane to Impella inlet distance measured on CT was significantly shorter in those that had their Impella re-positioned (22.3 ± 28.6 vs. 35.8 ± 13.3 mm, P = 0.045) [Figure 2]. All other imaging measures were not significantly different. Analyzing repositioning cases alone for Impella CP, the model that had the greatest prevalence in this study, we also see similar results on CT with the carina to aortic valve plane distance being significantly larger in subjects that had their Impella re-positioned (86.3 ± 15.5 vs. 68.1 ± 13.2 mm, P = 0.022) and the aortic valve plane to Impella inlet distance measured being significantly shorter in those that had their Impella re-positioned (3.33 ± 5.77 vs. 33.5 ± 12.3 mm, P < 0.0001) [Supplementary Table 1]. When examining those that were identified as having optimal device positioning on echocardiography to those with suboptimal positioning, there were no significant differences in any imaging measures examined [Table 2].
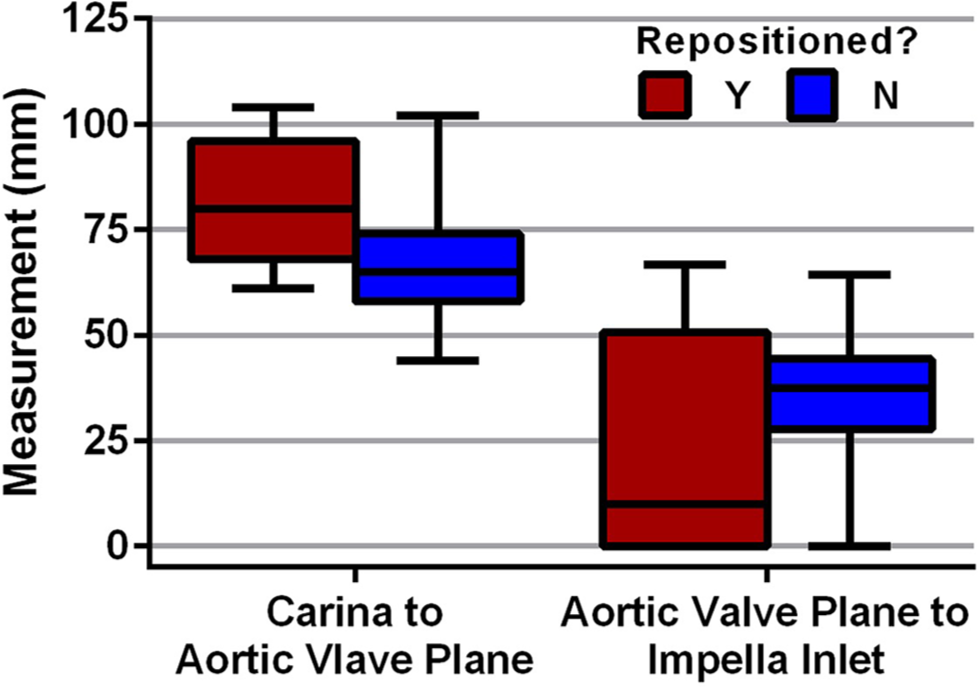
- Computed tomography measurements between repositioned Impella vs. non-repositioned Impella devices. Box plot for CT measurements compared between those that had their Impella device re-positioned and those that did not require any repositioning.
| Measure | Repositioned (n=12) | Not Repositioned (n=83) | P-value* | Optimally positioned (n=60) | Not optimally positioned (n=35) | P-value† | Overall (n=95) |
|---|---|---|---|---|---|---|---|
| CT^ | |||||||
| Aortic Arch to Carina | 45.8±6.53 | 50.7±10.9 | P=0.32 | 50.4±11.6 | 50.5±8.67 | P=0.98 | 50.5±10.7 |
| Aortic Arch to Aortic Valve Plane | 127±19.9 | 118±15.4 | P=0.18 | 117±15 | 121±17.2 | P=0.28 | 118±15.8 |
| Carina to Aortic Valve Plane | 81.6±15.9 | 67±13.2 | P=0.019 | 66.6±12.6 | 70.4±15.7 | P=0.23 | 67.8±13.7 |
| Aortic Valve Plane to Impella Inlet | 22.3±28.6 | 35.8±13.3 | P=0.045 | 35.7±11.8 | 33.5±19.5 | P=0.51 | 35±14.7 |
| Scout | |||||||
| Aortic Arch to Carina | 41±6.64 | 40.9±8.53 | P=0.95 | 40±8.22 | 42.3±8.31 | P=0.2 | 40.9±8.28 |
| Aortic Arch to Impella Outlet | 44.1±10.7 | 43.1±15.4 | P=0.82 | 42.5±13.6 | 44.3±16.8 | P=0.58 | 43.2±14.8 |
| Carina to Impella Outlet | 3.08±13.2 | 2.91±14.2 | P=0.97 | 3.46±12.4 | 2.03±16.6 | P=0.63 | 2.94±14 |
| CXR | |||||||
| Aortic Arch to Carina (cannula) | 26.8±11.1 | 27.5±11.4 | P=0.86 | 26.4±10.9 | 29.7±12 | P=0.24 | 27.4±11.3 |
| Aortic Arch to Carina (vessel) | 49.7±7.87 | 47.5±10.1 | P=0.46 | 47.6±10.4 | 48±8.89 | P=0.83 | 47.8±9.85 |
| Aortic Arch to Impella Outlet | 61.1±18 | 57.8±20.2 | P=0.59 | 57.8±18.1 | 58.9±22.9 | P=0.81 | 58.2±19.9 |
| Carina to Impella Outlet | 11.4±23.2 | 10.3±19.2 | P=0.86 | 10.3±17 | 10.8±23.7 | P=0.89 | 10.5±19.6 |
| Angle of Inlet and Outlet Valve | 124±22.8 | 122±17.1 | P=0.68 | 121±16.2 | 124±20.5 | P=0.46 | 122±17.8 |
| Central line | |||||||
| Aortic Valve to Aortic Arch | 112±15 | 114±13.8 | P=0.54 | 114±13.4 | 114±15 | P=0.84 | 114±13.9 |
| Aortic Valve to Inlet | 36.1±21.9 | 38.4±13 | P=0.61 | 39±11.5 | 36.7±18.1 | P=0.46 | 38.1±14.3 |
| Categorical | |||||||
| Contrast (% Yes) | n=1/12 (8.33% [0.211–38.5%]) | n=7/82 (8.54% [3.5–16.8%]) | P>0.99 | n=4/59 (6.78% [1.88–16.5%]) | n=4/35 (11.4% [3.2–26.7%]) | P=0.46 | |
| Placement Type (% Femoral) | n=10/12 (83.3% [51.6–97.9%]) | n=70/83 (84.3% [74.7–91.4%]) | P>0.99 | n=56/60 (93.3% [83.8–98.2%]) | n=24/35 (68.6% [50.7–83.1%]) | P=0.0026 | |
| Catheter Position (% Bottom) | n=10/12 (83.3% [51.6–97.9%]) | n=50/83 (60.2% [48.9–70.8%]) | P=0.15 | n=43/60 (71.7% [58.6–82.5%]) | n=17/35 (48.6% [31.4–66%]) | P=0.0053 | |
^These exclude seven cases where CT was performed after re-positioning. *Repositioned versus not repositioned. †Optimally positioned versus sub-optimally positioned. P values that were bolded were found to be statistically significant. In the CXR measurements, aortic arch positioning was both measured by the cannula of the Impella device, as well as the top of the vessel silhouette. CT: Computed tomography, CXR: Chest radiography, ±: Standard deviation
Prediction of impella re-positioning
Prediction of Impella re-positioning based on imaging measured was performed with logistic regression [Table 3]. As for the comparisons above, carina to aortic valve plane distance was the only significant predictor of Impella re-positioning.
| Measure | Univariate | |
|---|---|---|
| Odds ratio | P-value | |
| CT^ | ||
| Aortic Arch to Carina | 0.955 (0.872–1.05) | 0.32 |
| Aortic Arch to Aortic Valve Plane |
1.04 (0.98–1.11) | 0.19 |
| Carina to Aortic Valve Plane | 1.08 (1.01–1.15) | 0.032 |
| Aortic Valve Plane to Impella Inlet | 0.946 (0.893–1) | 0.057 |
| Scout | ||
| Aortic Arch to Carina | 1 (0.931–1.08) | 0.95 |
| Aortic Arch to Impella Outlet | 1 (0.965–1.05) | 0.82 |
| Carina to Impella Outlet | 1 (0.958–1.05) | 0.97 |
| CXR | ||
| Aortic Arch to Carina (cannula) | 0.995 (0.937–1.06) | 0.86 |
| Aortic Arch to Carina (vessel) | 1.02 (0.962–1.09) | 0.46 |
| Aortic Arch to Impella Outlet | 1.01 (0.979–1.04) | 0.59 |
| Carina to Impella Outlet | 1 (0.972–1.03) | 0.86 |
| Angle of Inlet and Outlet Valve | 1.01 (0.972–1.04) | 0.68 |
| Central line | ||
| Aortic Valve to Aortic Arch | 0.986 (0.943–1.03) | 0.54 |
| Aortic Valve to Inlet | 0.989 (0.949–1.03) | 0.6 |
| Categorical | ||
| Contrast (Yes vs. No) | 0.974 (0.109–8.69) | 0.98 |
| Placement Type (Axial vs. Femoral) |
1.08 (0.211–5.49) | 0.93 |
| Catheter Position (Top vs. Bottom) |
1.43e-44 (0-Inf) | >0.99 |
Predicting Impella repositioning status based on imaging characteristic measured. ^These exclude 7 cases where CT was performed after re-positioning. P values that were bolded were found to be statistically significant. CT: Computed tomography, CXR: Chest radiography
Predicting CT measures with other modalities
To determine whether other imaging modalities could predict measurements that were only made on CT, we used univariate and multivariable linear regression [Table 4 and Supplementary Table 2]. As can be seen, multiple imaging measures were significant predictors of aortic valve plane to Impella inlet and carina to aortic valve plane distances on CT [Table 4]. These significant predictors persisted when controlling for BMI and height [Supplementary Table 2].
| Modality | Measure | CT aortic valve plane to Impella inlet | CT carina to aortic valve plane |
|---|---|---|---|
| Scout | Aortic Arch to Carina | 0.847 (0.585–1.23, P=0.38) | 0.964 (0.683–1.36, P=0.84) |
| Aortic Arch to Impella Outlet | 1.54 (1.28–1.85,P<0.0001) | 1.61 (1.37–1.9,P<0.0001) | |
| Carina to Impella Outlet | 1.65 (1.36–1.99,P<0.0001) | 1.7 (1.43–2.02,P<0.0001) | |
| CXR | Aortic Arch to Carina (cannula) | 0.819 (0.616–1.09, P=0.17) | 0.865 (0.655–1.14, P=0.31) |
| Aortic Arch to Carina (vessel) | 0.801 (0.587–1.09, P=0.17) | 0.988 (0.737–1.32, P=0.93) | |
| Aortic Arch to Impella Outlet | 1.29 (1.12–1.49,P=0.00081) | 1.33 (1.17–1.52,P<0.0001) | |
| Carina to Impella Outlet | 1.39 (1.2–1.6,P<0.0001) | 1.36 (1.19–1.55,P<0.0001) | |
| Angle of Inlet and Outlet Valve | 1.42 (1.2–1.68, P<0.0001) | 1.08 (0.914–1.28, P=0.36) | |
| Central Line | Aortic Valve to Aortic Arch | 0.865 (0.694–1.08, P=0.2) | 1.57 (1.31–1.89,P<0.0001) |
| Aortic Valve to Inlet | 2.47 (2.27–2.67,P<0.0001) | 0.95 (0.776–1.16, P=0.62) |
Results of univariate linear regression with CT measure as outcome, and individual measurements as predictors. Reported values are odds ratio (95% CI, P-value). P-values that were bolded were found to be statistically significant. CT: Computed tomography, CXR: Chest radiography
Using these linear regression models, predicted values of carina to aortic valve plane were generated from CXR measures [Table 4]. As can be seen, the mean values are similar between known CT values and CXR predictions. However, the poor intraclass correlation indicates that prediction at the level of individual subjects is unsatisfactory.
Imaging modality agreement
For measures that were assessed on multiple imaging modalities, agreement is shown in Supplementary Table 3. Similarity between aortic arch and carina distance on CT, CXR, and scout is shown in Supplementary Figure 5. Agreement ranged from fair to excellent, with the best agreement being between CT and central line on aortic valve plane to Impella inlet distance (Intraclass Correlation Coefficient [ICC] = 0.91 [0.848–0.946], P < 0.0001).
Identification of complications associated with impella pump
Cases of Impella complications were found while making measurements for this study. Gross examination of the Impella within CXR and CT imaging modalities could be used to see the mispositioning and complications in a few of these select cases. CXR and CT were able to identify high and low Impella positionings [Figures 3 and 4]. Once suspected of mispositioning, both high and low Impella devices could be repositioned, under guidance of ultrasound, to their optimal positioning [Supplementary Figure 6]. CT could also identify LV perforation from Impella [Supplementary Figure 7] and thrombus formation along the Impella catheter [Supplementary Figure 8].
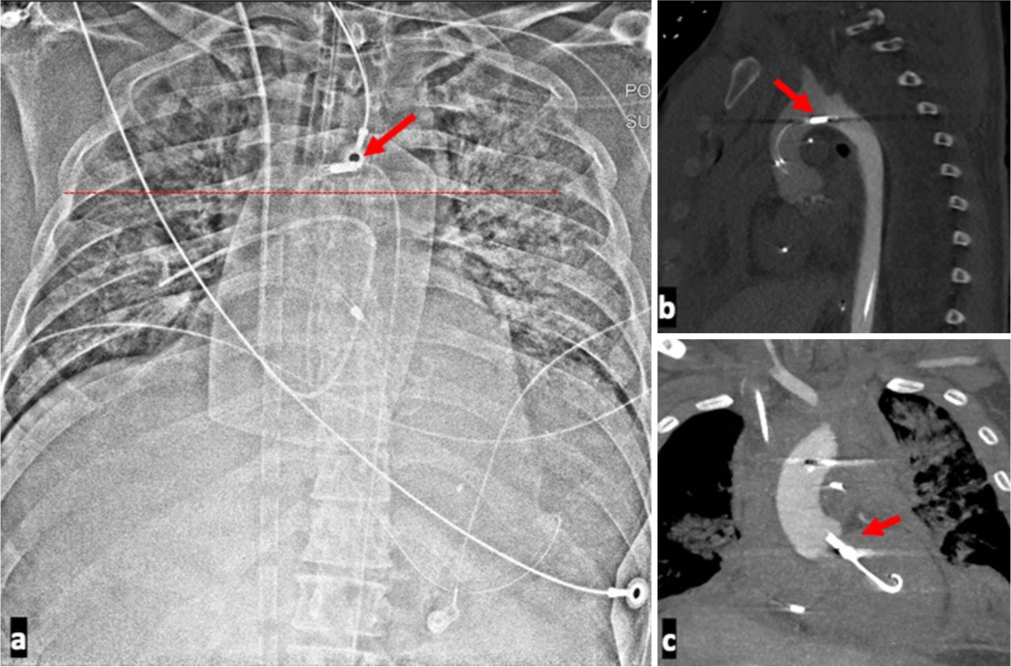
- A 39-year-old male presenting with cardiac arrest with ST-elevation myocardial infarction with unstable hemodynamics placed on Impella support and found to have a high Impella positioning. (a) Chest radiograph of high positioned Impella. The outlet port, indicated by the red arrow, can be seen in the aortic arch indicating a malposition. (b) Associated sagittal computed tomography shows the outlet port in the aortic arch as indicated by the red arrow. The outlet of the device should be in the ascending aorta. (c) Associated coronal CT shows the inlet port at the level of the aortic valve plane as indicated by the red arrow. The pigtail end of the Impella is likely in the sub-mitral chordal apparatus. Echo reported as distance of 1.5 cm form the aortic valve plane confirming. A suboptimal position. The lack of opacification of the left ventricle on this contrast enhanced computed tomography angiography is due to reversed contrast flow direction in the aorta as the patient was also on a peripheral venoarterial extracorporeal membrane oxygenation (VA ECMO).
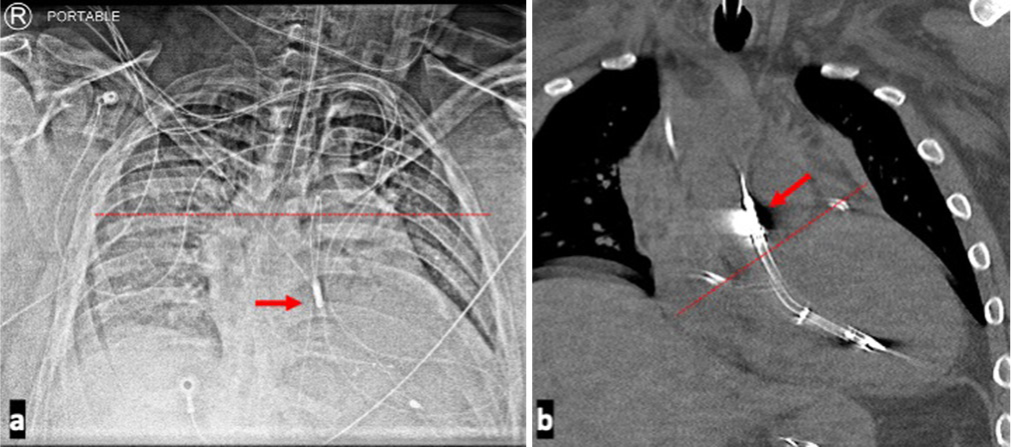
- A 35-year-old male presenting with non-ST-elevation myocardial infarction complicated by cardiogenic shock requiring Impella support and found to have a Low Impella positioning. Imaging modalities demonstrating low Impella positioning. (a) Chest radiograph shows the level of the carina indicated by the dotted line, while the arrow demarcates the Impella outlet below the carina. Significant distance between the carina and Impella outlet port should raise the suspicion for a lower Impella placement. (b) Coronal computed tomography image of the patient shows outlet port of the Impella device, indicated by the red arrow, very proximal to the marked level of the aortic valve plane which is marked by the dotted line. The inlet port is deep within the left ventricle.
Echocardiography characteristics
TTE and TEE were both analyzed to characterize each patient’s Impella device in terms of the device depth and rotation within the heart. Between the repositioned and not repositioned groups of Impella cases depth characterization of deep, optimal, or shallow did not show a significant difference between the two groups (P = 0.057) [Supplementary Table 4]. In addition, echocardiographic characterization of Impella rotation being mitrally, optimally, or septally rotated did not show a significant difference between the repositioned or not repositioned as well (P = 0.93) [Supplementary Table 4].
DISCUSSION
CXR and CT performance in the evaluation of optimal Impella positioning and identification of associated complications in patients on these devices is currently not well known. This paper presents the first study evaluating Impella pump position using CXR and CT scans when compared to the gold standard of echocardiography.
There is an important opportunity to evaluate patients on Impella with radiographs and CT that is underutilized. There is a good correlation in the identification of mispositioned Impella between non-ECG gated CT and echocardiography specifically when looking at measures such as aortic valve plane to Impella inlet on CT. In the evaluation of clinical reports of radiographs and CTs, there are scant references to the position of the device on CXR and CT which serve as missed opportunities to provide important clinical insight.
On evaluation of the clinical reports in this cohort, only one patient with malposition was correctly identified by CXR and malposition was reported only on three CT reports.
CT performs well in the identification of inlet as well as outlet port. There is a good correlation in the distance measured of the inlet port from the aortic valve plane between CT and echocardiography. This has important clinical implications. This suggests that CT can be very useful when the acoustic window to evaluate these devices is suboptimal on TTE. Intra and extracardiac complications can also be elucidated when using CXR and CT imaging modalities in the assessment of Impella device placement as well. In this cohort, nine patients had additional mediastinal findings on CT that was not identified on echocardiography. Additional findings of pulmonary and pleural complications were seen on 90 of the 95 patients by CXR and 95 of the 95 patients by CT. This holds a lot of potential for the diagnosis of extracardiac complications that cannot be accounted for when TTE alone is used to assess Impella device positioning.
The agreement between the different measurements obtained with CT (axial vs. central line) for the position of the aortic valve plane to Impella inlet and outlet was very good including CT without intravenous contrast. This suggests that CT scans have a unique capacity for Impella pump evaluation that current commonly used modalities like CXRs do not have. This study also confirms that the aortic valve plane to inlet port distance is similar for CT and TTE.
The aortic valve plane had an average of 6.8 cm (standard deviation = 1.3 cm) from the carina using all the cases based on CT. This can serve as a useful measurement when evaluating the Impella on CXR. Other landmark measurements were also significant predictors of the aortic valve plane to carina distance. These included aortic arch to Impella outlet on both CT scout and CXR, as well as carina to Impella outlet on both CT scout and CXR. This shows value in the CXR modality to extrapolate an important anatomical landmark that is useful in delineating positioning of the Impella device.
There are important limitations to this study. The study sample size is small and a high percentage of the sample were male at 78.9%. The CT images were obtained without ECG gating which can limit assessment of the device position during the cardiac cycle. The systolic phase images may have an advantage in evaluating the inlet port and pigtail portion entanglement with the mitral valve apparatus. Another limitation of this study is the identification of Impella mispositioning in echocardiography. Often, in the cardiac ICU, Impella device is repositioned using bedside TEE. It is possible that some of the Impella devices in the correct positioning group did undergo manipulation without documentation. Furthermore, in patients with small LV cavity size (those with concomitant use of extracorporeal membrane oxygenation [ECMO]), there may not be enough space to place the device at the recommended distance. Future research can be directed toward additional specific comparison between TTE and ECG gated CT. These can include evaluating cardiac function and changes in cardiac chamber size.
CONCLUSION
This study identifies an important role that CXR and CT have in evaluating Impella device placement, complementing the standard use of echocardiography, which may prove clinically useful, especially in patients with suboptimal cardiac windows for TTE. CT was found to be able to evaluate the entire catheter assembly and both intra- and extracardiac complications. Specific measurements on CT, such as the distance from the carina to the aortic valve plane and from the aortic valve plane to the Impella inlet, were significant indicators in differentiating between patients requiring Impella repositioning and those who did not. Furthermore, the high level of agreement between CXR and CT measurements, and the ability for prediction of measurements across imaging modalities, highlights the broad potential for clinical utility of CXR and CT in the assessments of Impella positioning.
Ethical approval
The Institutional Review Board has waived the ethical approval for this study as this is a single-center retrospective study.
Declaration of patient consent
Patient’s consent is not required as there are no patients in this study.
Conflicts of interest
There are no conflicts of interest.
Use of artificial intelligence (AI)-assisted technology for manuscript preparation
The authors confirm that there was no use of artificial intelligence (AI)-assisted technology for assisting in the writing or editing of the manuscript and no images were manipulated using AI.
Financial support and sponsorship: Nil.
References
- Emergency use of impella left ventricular support systems during the COVID-19 outbreak. Available from: https://www.fda.gov/media/140763/download [Last accessed on 2023 Sep 03]
- [Google Scholar]
- Impella-induced incessant ventricular tachycardia. Ochsner J. 2019;19:248-51.
- [CrossRef] [PubMed] [Google Scholar]
- The evolving landscape of impella use in the United States among patients undergoing percutaneous coronary intervention with mechanical circulatory support. Circulation. 2020;141:273-84.
- [CrossRef] [PubMed] [Google Scholar]
- Use of impella ventricular assist device in patients with severe coronary artery disease presenting with cardiac arrest. Int J Angiol. 2012;21:163-6.
- [CrossRef] [PubMed] [Google Scholar]
- Intra-aortic balloon pump for high-risk percutaneous coronary intervention. Circ Cardiovasc Interv. 2014;7:712-20.
- [CrossRef] [PubMed] [Google Scholar]
- A prospective, randomized clinical trial of hemodynamic support with impella 2.5 versus intra-aortic balloon pump in patients undergoing high-risk percutaneous coronary intervention. Circulation. 2012;126:1717-27.
- [CrossRef] [PubMed] [Google Scholar]
- Impella ventricular support systems for use during cardiogenic shock. Available from: https://www.accessdata.fda.gov/cdrh_docs/pdf14/p140003s004d.pdf [Last accessed on 2023 Sep 04]
- [Google Scholar]
- Impella 5.5 with SmartAssist for use during cardiogenic shock. Available from: https://www.fda.gov/media/140766/download [Last accessed on 2023 Sep 03]
- [Google Scholar]
- The Impella device: Historical background, clinical applications and future directions. Int J Angiol. 2019;28:118-23.
- [CrossRef] [PubMed] [Google Scholar]
- Chest radiography in the ICU: Part 2, evaluation of cardiovascular lines and other devices. Am J Roentgenol. 2012;198:572-81.
- [CrossRef] [PubMed] [Google Scholar]
- Radiographic review of current therapeutic and monitoring devices in the chest. Radiographics. 2018;38:1027-45.
- [CrossRef] [PubMed] [Google Scholar]
- Imaging of mechanical cardiac assist devices. J Clin Imaging Sci. 2011;1:21.
- [CrossRef] [PubMed] [Google Scholar]
- A Review of the Impella devices. Interv Cardiol Lond Engl. 2022;17:e05.
- [CrossRef] [PubMed] [Google Scholar]
- Intensive care unit management of percutaneous mechanical circulatory supported patients: The role of imaging. Eur Heart J Suppl. 2021;23(Suppl A):A15-22.
- [CrossRef] [PubMed] [Google Scholar]
- Assessment of cardiac device position on supine chest radiograph in the ICU: Introduction and applicability of the aortic valve location ratio. Crit Care Med. 2016;44:e957-63.
- [CrossRef] [PubMed] [Google Scholar]
- Mechanical circulatory support in acute heart failure. Tex Heart Inst J. 2012;39:854-5.
- [Google Scholar]
- Cardiac failure: Mechanical support strategies. Crit Care Med. 2006;34:S268.
- [CrossRef] [PubMed] [Google Scholar]