Translate this page into:
Usefulness of high tube voltage conditions in CT Fluoroscopy during CT-guided biopsy: Preliminary study

*Corresponding author: Kento Furihata, Division of Radiology, Shinshu University Hospital, Matsumoto, Nagano, Japan. kfurihata9@shinshu-u.ac.jp
-
Received: ,
Accepted: ,
How to cite this article: Furihata K, Miyagawa J, Tamaru N, Kubota H. Usefulness of high tube voltage conditions in CT Fluoroscopy during CT-guided biopsy: Preliminary study. J Clin Imaging Sci. 2025;15:13. doi: 10.25259/JCIS_7_2025
Abstract
Objectives
Computed tomography (CT)-guided biopsy is often used to increase the safety and accuracy of biopsies for disease diagnosis. However, CT-guided biopsy is associated with metal artifacts from the biopsy needle and increased patient and operator exposure due to frequent CT fluoroscopy. Therefore, we thought it possible to solve this problem by setting the CT fluoroscopy conditions to a higher tube voltage and a lower tube current-time product (high-tube voltage conditions) than recommended. As a preliminary study, metal artifacts, low-contrast detectability, patient and operator’s exposure, and visual changes in high-tube voltage conditions were assessed using phantoms and compared with recommended conditions.
Material and Methods
On an interventional radiology CT system, the phantom was scanned under recommended conditions (120 kV, 30 mAs) and high-tube voltage conditions (135 kV, 30–5 mAs). The metal artifacts and low-contrast detectability of each condition were analyzed and compared using the acquired images. In addition, the phantom surface dose assuming patient exposure and the air dose assuming the operator’s standing position were measured and compared. Furthermore, visual assessment was performed by six radiological technologists.
Results
Low-contrast detectability was slightly reduced, metal artifacts were significantly lower under high-tube voltage conditions, and patient and operator exposure were lower than the recommended conditions. Furthermore, the findings of the visual assessment were largely consistent with those of the physical assessment.
Conclusion
High-tube voltage conditions in CT fluoroscopy during CT-guided biopsy may be useful in reducing metallic artifacts and patient and operator radiation exposure.
Keywords
Computed tomography
Computed tomography fluoroscopy
Computed tomography-guided biopsy
Interventional radiology-computed tomography
Patient exposure

INTRODUCTION
A biopsy is one of the most useful clinical tests for diagnosing diseases and determining the extent of lesion spread. Computed tomography (CT)-guided biopsy is often used to improve the safety and accuracy of this procedure. This technique allows the biopsy needle to be advanced while confirming the CT image, allowing the positional relationship between the biopsy needle and the lesion to be determined and highly accurate biopsies to be performed.[1] CT fluoroscopy is also used in CT-guided biopsies.[2-4] CT fluoroscopy allows the operator to perform CT scans and view the images in near real time.[5] This increases safety and certainty and allows biopsies to be performed within a shorter examination time, which benefits patients.[6] However, significant problems with CT-guided biopsy include reduced image quality due to metal artifacts caused by the biopsy needle and increased radiation exposure for patients and operators due to frequent CT scans. In recent years, remarkable progress has been made in metal artifact reduction techniques, and methods using image reconstruction processing and virtual monochromatic images using dual-energy CT have been reported.[7,8] However, due to the characteristics of CT fluoroscopy, which displays images in near real-time, it has yet to be combined with CT fluoroscopy. In addition, radiation exposure to the operator is unavoidable because a puncture is performed during CT imaging. Although some reports indicate that robotic biopsies may eliminate operator radiation exposure, it is expected that it will be some time before the use of robotic biopsies becomes widespread, due to initial costs and other issues.[9,10] At present, the recommended imaging parameters for CT fluoroscopy in abdominal CT-guided biopsy, as outlined in the “GALACTIC” CT imaging guidelines supervised by the Japanese Society of Radiological Technology, are 120 kV and 30 mAs or less.[11] In response, we thought that it was possible to simultaneously reduce metal artifacts caused by the biopsy needle and radiation exposure using a high-tube voltage and a low tube current-time product. Therefore, this study aimed to reduce metal artifacts caused by the biopsy needle and radiation exposure by high-tube voltage in CT fluoroscopy for CT-guided biopsy, and as a preliminary study, a phantom study was performed.
MATERIAL AND METHODS
Scan parameters and phantom
An – Interventional Radiology (IVR) – CT system (Aquilion One NATURE Edition, Canon Medical Systems) was used. In this study, we set the recommended conditions and high-tube voltage conditions. The scan parameters of the recommended condition were set as follows: tube voltage, 120 kV; tube current, 60 mA; rotation time, 0.5 s; tube current time product, 30 mAs; reconstructed image matrix, 512 × 512; reconstruction kernel, FC 17; reconstruction algorithm, Adaptive Iterative Dose Reduction 3D; slice thickness, 2 mm; and field of view (FOV), 360 mm. High-tube voltage conditions were set as follows: Tube voltage, 135 kV; tube current, 60 mA,50 mA,40 mA, 30 mA, 20 mA, and 10 mA; rotation time, 0.5 s; tube current time product, 30 mAs, 25 mAs, 20 mAs, 15 mAs, 10 mAs, and 5 mAs; reconstructed image matrix, 512 × 512; reconstruction kernel, FC 17; reconstruction algorithm, AIDR 3D; slice thickness, 2 mm; and FOV, 360 mm. The scan time was 5 s under all conditions.
The volume CT dose index (CTDIvol) for each condition is 5.1 mGy for the recommended condition and 7.2 mGy, 6 mGy, 4.8 mGy, 3.6 mGy, 2.4 mGy, and 1.2 mGy for the high-tube voltage condition from 30 mAs to 5 mAs, respectively. Table 1 summarizes the key parameters for the recommended conditions and high-tube voltage conditions used in this study.
| Condition | Tube voltage (kV) | Tube current-time product (mAs) | CTDIvol (mGy) |
|---|---|---|---|
| Recommended | 120 | 30 | 5.1 |
| High-tube voltage | 135 | 30 | 7.2 |
| 25 | 6.0 | ||
| 20 | 4.8 | ||
| 15 | 3.6 | ||
| 10 | 2.4 | ||
| 5 | 1.2 |
CTCIvol: Volume computed tomography dose index
To obtain images similar to clinical images, a self-made phantom that could puncture a biopsy needle was constructed. The CT value of this phantom is approximately 0 Hounsfield Unit (HU). The powdered agar was mixed with boiling water, poured into a plastic container (200 mm diameter), and cooled to allow the agar to solidify. The contrast module was placed at the phantom’s center, assuming the biopsy’s target site. A diagram of the self-made phantom is shown in Figure 1. This contrast module is an agar prepared by diluting an iodine contrast medium (300 mgI/mL) with a CT value of approximately 50 HU. In our clinical practice, the minimum difference between the CT value of the lesion and the CT value on the puncture path was about 60 HU, so the CT value difference between the phantom and the contrast module was set to be about 50 HU, which is less than that.
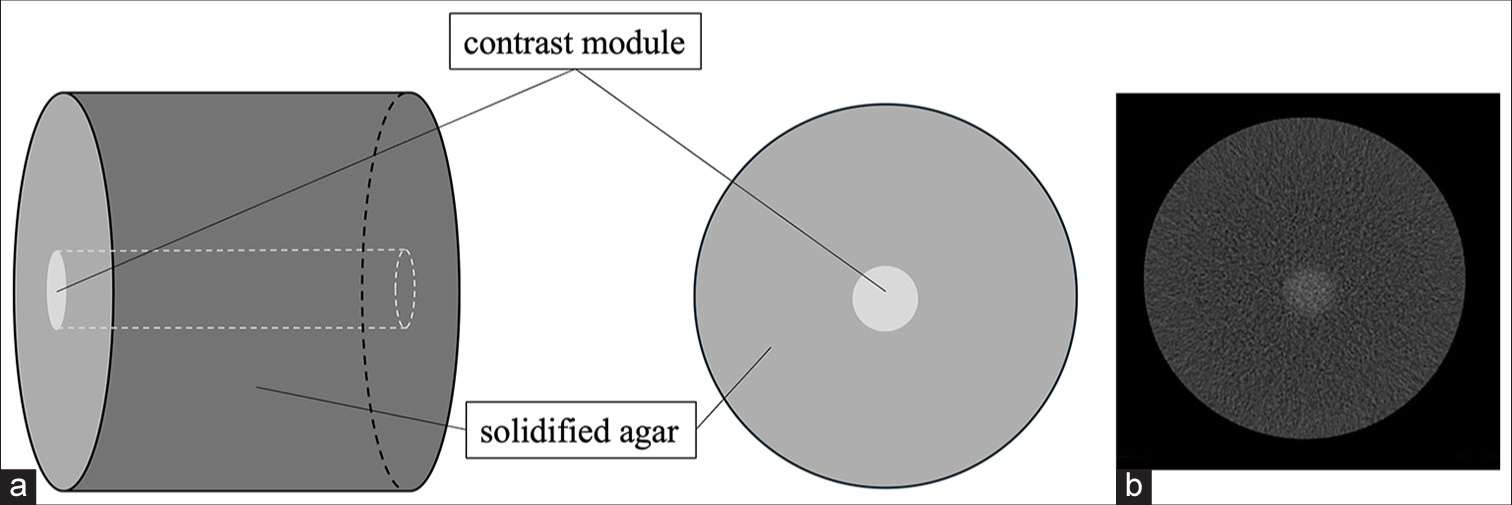
- (a) Diagram of the self-made phantom and (b) computed tomography image.
Noise properties
The noise power spectrum (NPS) of the CT system used in this study was evaluated to confirm that the frequency properties did not change when the tube voltage and tube current-time product were varied. The noisy images used for the NPS evaluation were acquired by imaging the uniformity module (CTP712) of the CT evaluation phantom (Catphan CTP700, The Phantom Laboratory). Ten CT scans were performed for each condition, and 100 noise images were acquired. NPS was measured using a region of interest (ROI) of 128 × 128 pixels positioned in a uniform area of the acquired image. The ROI size was set as 50% of the phantom diameter. The NPS calculation was based on an established method using a two-dimensional (2D) Fast Fourier Transform.[12] NPS was calculated for each dataset and averaged. CT measure ver. 0.99d[13] was used for measurements.
Metal artifact
Artifact Index (AI) values have been used to evaluate metal artifacts.[14,15] As shown in Figure 2, a 128 × 64 pixel rectangular ROI was set in the center of the image before and after the biopsy needle (OSTYCUT 14.5G, Medicon) was inserted into the self-made phantom, and the standard deviation (SD) of the CT values was measured. The artificial intelligence (AI) value was calculated using equation (1):
where SDArt is the SD in the artifact image after biopsy needle puncture and SDBG is the SD in the background (BG) before biopsy needle puncture.
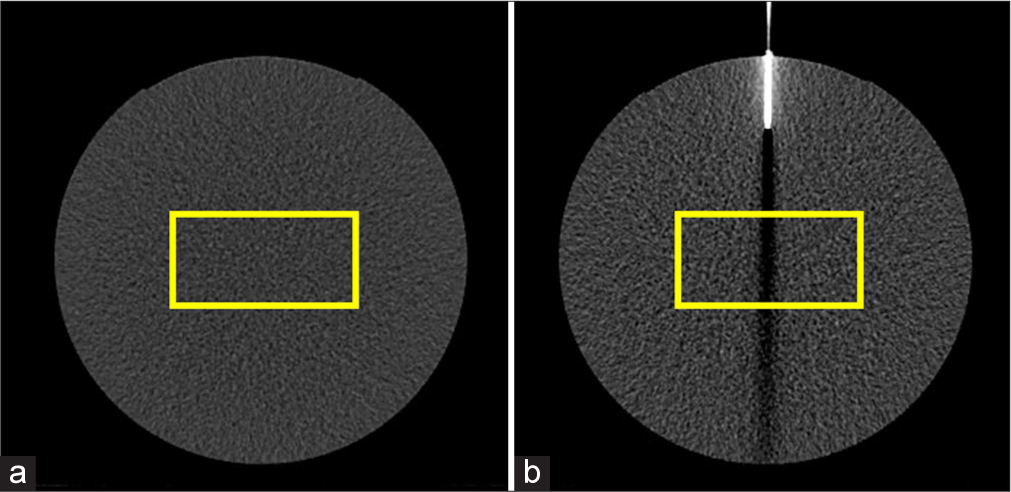
- Example of region of interests (yellow rectangle) on phantom images in (a) before and (b) after puncture.
Because it has been reported that the AI value is proportional to the noise level and the ratio of streak artifacts to the noise level is constant regardless of the scan dose,[16] no comparison was made for conditions with different scan doses, and the effect of different tube voltages on metal artifacts was evaluated. Therefore, AI values were measured for the recommended condition (120 kV, 30 mAs) and high-tube voltage condition (135 kV, 20 mAs).
We used image J (National Institutes of Health, USA) to measure SD.
Low contrast detectability
To evaluate the effect of using a high-tube voltage on image contrast, the contrast to noise ratio (CNR) was measured to assess low-contrast detectability. The CT values and SD were measured in ROIs set on the contrast module of the self-made phantom and in the immediate BG, and the CNR was calculated according to equation: [2]
where ROIs is the CT value in the ROI set of the contrast module, ROIBG is the CT value in the ROI set of the BG, and SDBG is the SD in the ROI set of the BG.
CT values and SD were measured with image J.
Patient exposure
The entrance surface dose (ESD) was measured to evaluate patient exposure. Three fluorescent glass dosimeters (GD-302M, Asahi Technoglass, JAPAN) were placed in the center of the dorsal part of a human equivalent pelvic phantom (RAN-100, The Phantom Laboratory, USA) set in the prone position, and five seconds of CT fluoroscopy was performed to measure the ESD under each condition. The imaging area had the largest diameter in the pelvic region. Measurements were performed 3 times under each condition, and the average value was calculated. The phantom center was set 5 cm below the isocenter, assuming the bed was lowered to allow the operator to maintain the range during the procedure. To compare the ESD of each condition, the rate of change of the high-tube voltage condition relative to the recommended condition was determined using equation (3):
where α is the ESD at each tube current time product at a tube voltage of 135 kV, and β is the ESD under the recommended conditions.
Operator’s exposure
The air dose in the operator’s standing position was measured to evaluate the operator’s exposure. Three CT fluoroscopic examinations were performed on a human-equivalent pelvic phantom under each condition, and the average air dose was calculated. The fluoroscopy duration was 5 s. An ionization chamber survey meter (ICS-1323, ALOKA, JAPAN) was used for the measurements. The measurement locations were 100 and 150 cm high at a point 60 cm from the puncture site, assuming that the operator stood during the procedure [Figure 3]. The heights of each were assumed to be those of the abdomen and lens. The device’s structural limitations necessitated that the operator’s standing position maintain a distance of 60 cm from the puncture site. The height of the bed and the imaging area were the same as those used in the patient exposure assessment.
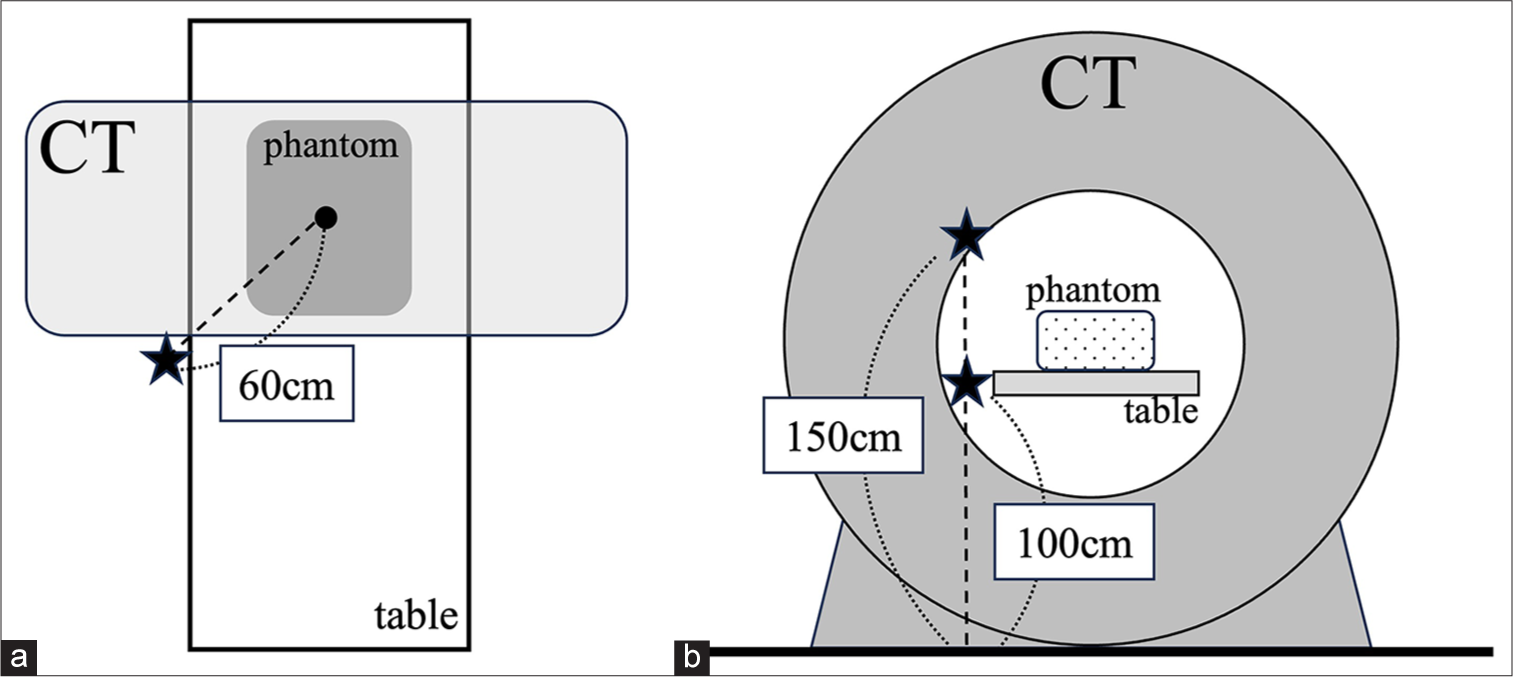
- Overview of the position of the air dose measurements. (a) View from the ceiling. (b) View from the caudal (CT: Computed tomography).
For the air dose, the rate of change in the high-tube voltage condition relative to the recommended condition was also calculated using Equation (3). Here, α is the air dose at each tube current time product at a tube voltage of 135 kV, and β is the air dose under the recommended conditions.
Visual assessment
CT fluoroscopic images obtained during CT biopsy procedures are viewed in real time on a monitor in the room; therefore, visual assessment and physical characteristics of the images are essential for evaluation. Therefore, visual assessment was performed on a self-made phantom image using a biopsy needle.
Images taken under the recommended conditions were compared with images taken at different doses under the high-tube voltage conditions. The images under the high-tube voltage conditions were graded on three levels: Superior (1 point), equal (0 point), and inferior (-1 point) to the images under the recommended conditions. The high-tube voltage conditions were randomly numbered with no information about the conditions, etc., and observers observed in any order. Three items were scored: the amount of metal artifacts, the contrast module’s discriminability, and the images’ granularity. All observers’ average scores were calculated, and the results were compared. The evaluation environment was designed to allow the observer to view images projected on a monitor at a distance of at least 1 m from the monitor without zooming or windowing. Six radiological technologists (years of experience: 9.8 ± 4.3 years) who routinely perform CT scans during biopsy procedures were used as observers, and a 19-inch color Liquid Crystal Display monitor (CLR190BN0JA, JVC, JAPAN) was used for evaluation.
Statistical analysis
Statistical analyses were performed using the Statistical Package for the Social Sciences for Windows (version 29.0; IBM Corp., Armonk, NY, USA). We compared the AI and CNRs between the recommended condition and the high-tube voltage conditions using the Wilcoxon signed-rank test. P < 0.05 was considered statistically significant.
RESULTS
Figure 4 shows the NPS for different tube voltages and tube current-time products. It can be observed that the NPS was higher for lower CTDIvol, yet the frequency properties remained unaltered. The AI values at different tube voltages are shown in Figure 5. The AI values were 37.6 ± 0.4 and 33.7 ± 0.5 for the recommended and high-tube voltage conditions, respectively, and were significantly lower (P < 0.05) for the high-tube voltage conditions.
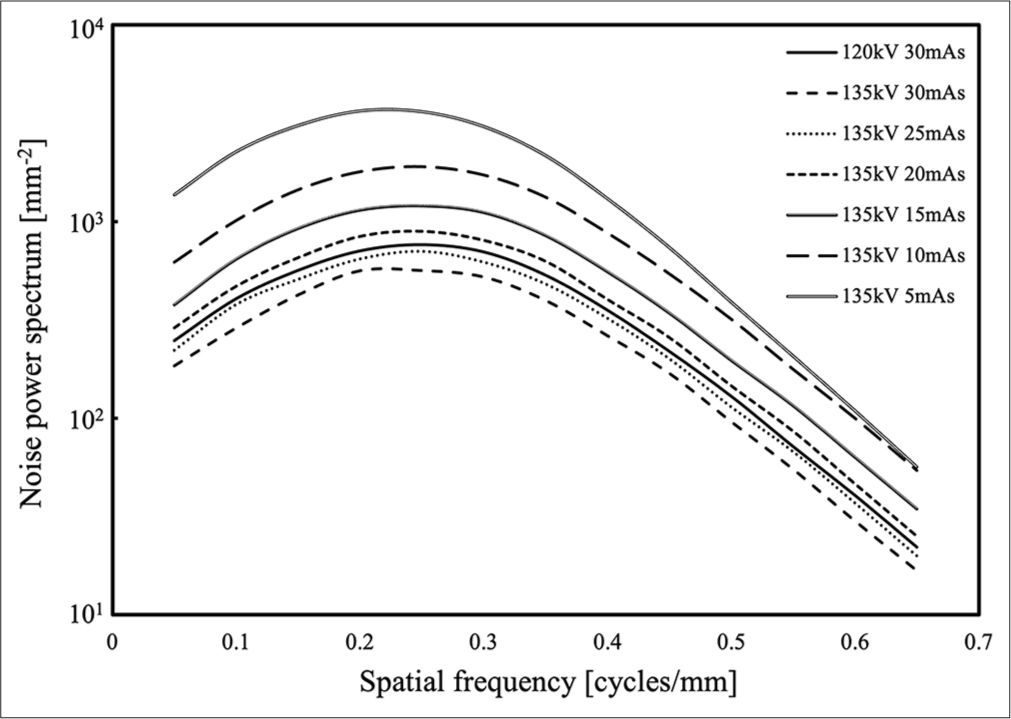
- Results of noise power spectrum at recommended conditions (120 kV, 30 mAs) and at each high-tube voltage condition (135 kV, 30 mAs to 135 kV, 5 mAs).
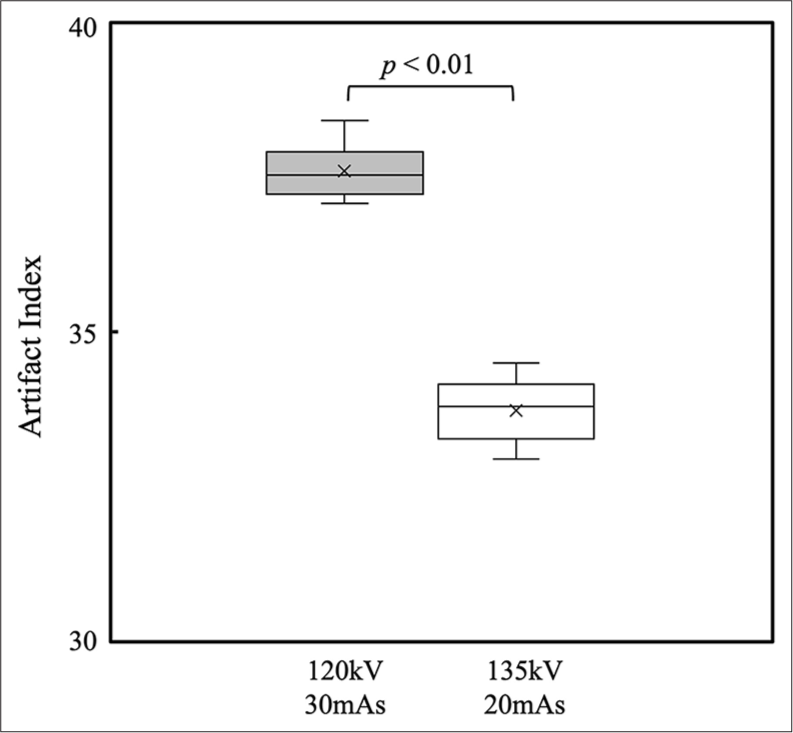
- Results of artifact index under recommended conditions (120 kV, 30 mAs) and under high-tube voltage conditions (135 kV, 20 mAs).
For low-contrast detectability, the CNR for the recommended condition was 2.37 ± 0.18, and the CNRs for the high-tube voltage condition were 2.44 ± 0.16, 2.33 ± 0.07, 2.09 ± 0.14, 1.69 ± 0.08, 1.41 ± 0.12, and 1.05 ± 0.15 from 30 mAs to 5 mAs, respectively [Figure 6]. No significant difference was observed in the CNR between the recommended conditions and the high-tube voltage conditions (30 mAs and 25 mAs). However, there was a significant difference between the conventional conditions and the high-tube voltage conditions of 20 mAs or less (P < 0.05).
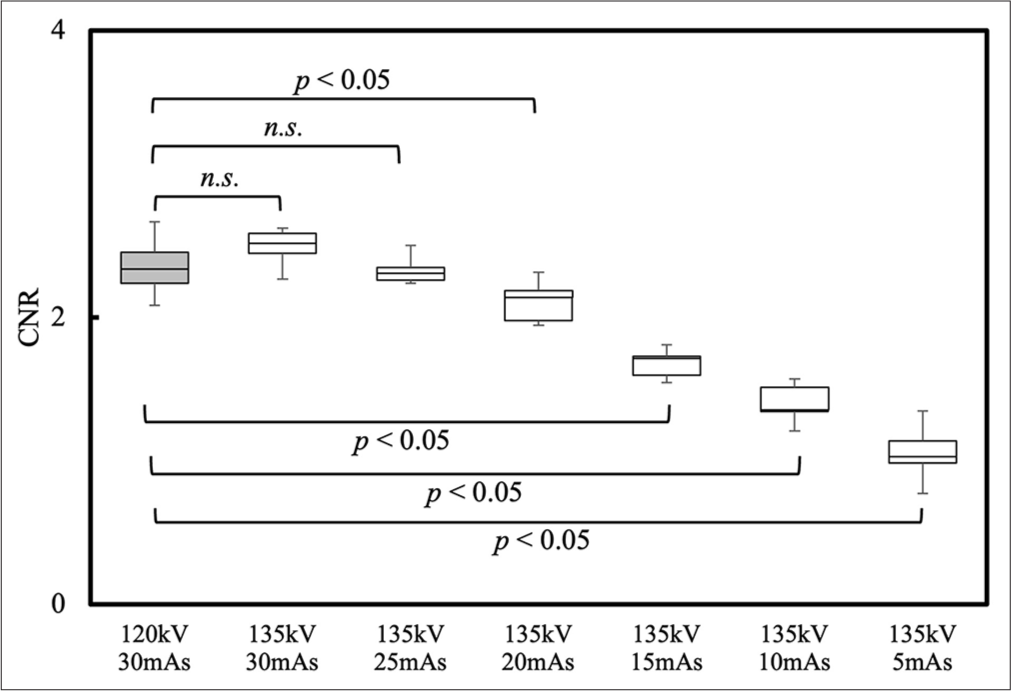
- Results of contrast to noise ratio at recommended conditions (120 kV, 30 mAs) and at each high-tube voltage condition (135 kV, 30 mAs to 135 kV, 5 mAs). (CNR: Contrast to noise ratio. n.s.: Not significant).
The ESD and air dose for each condition are shown in Figures 7 and 8, respectively, and their rates of change are summarized in Table 2. Both ESDs were lower than the recommended conditions at 135 kV and 20 mAs or less and higher at 30 mAs and 25 mAs.
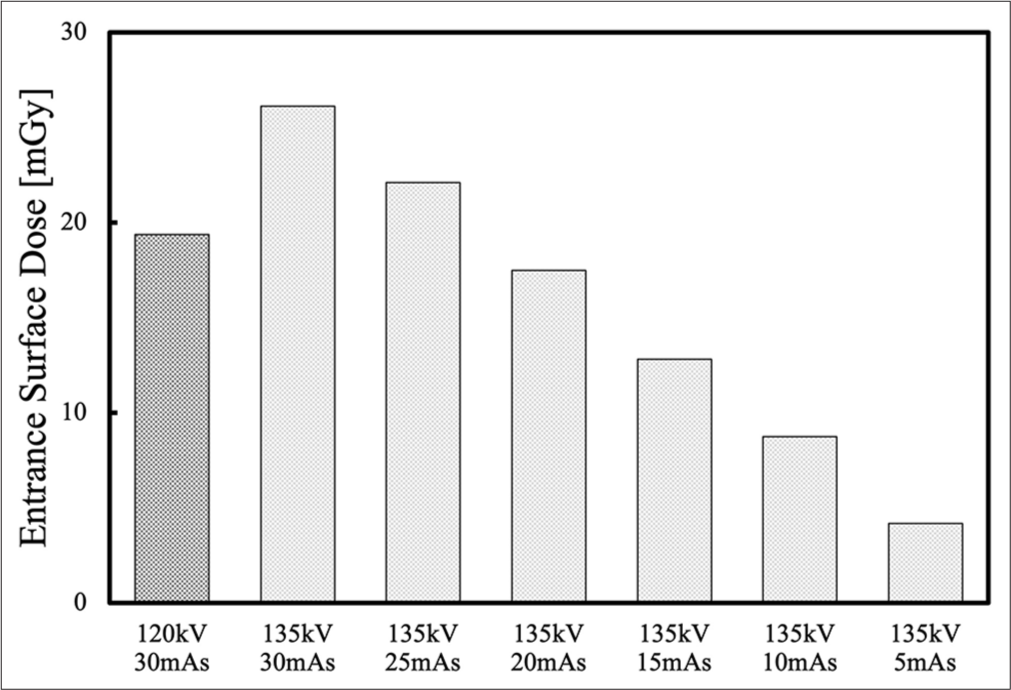
- Results of entrance surface dose at recommended conditions (120 kV, 30 mAs) and at each high-tube voltage condition (135 kV, 30 mAs to 135 kV, 5 mAs).
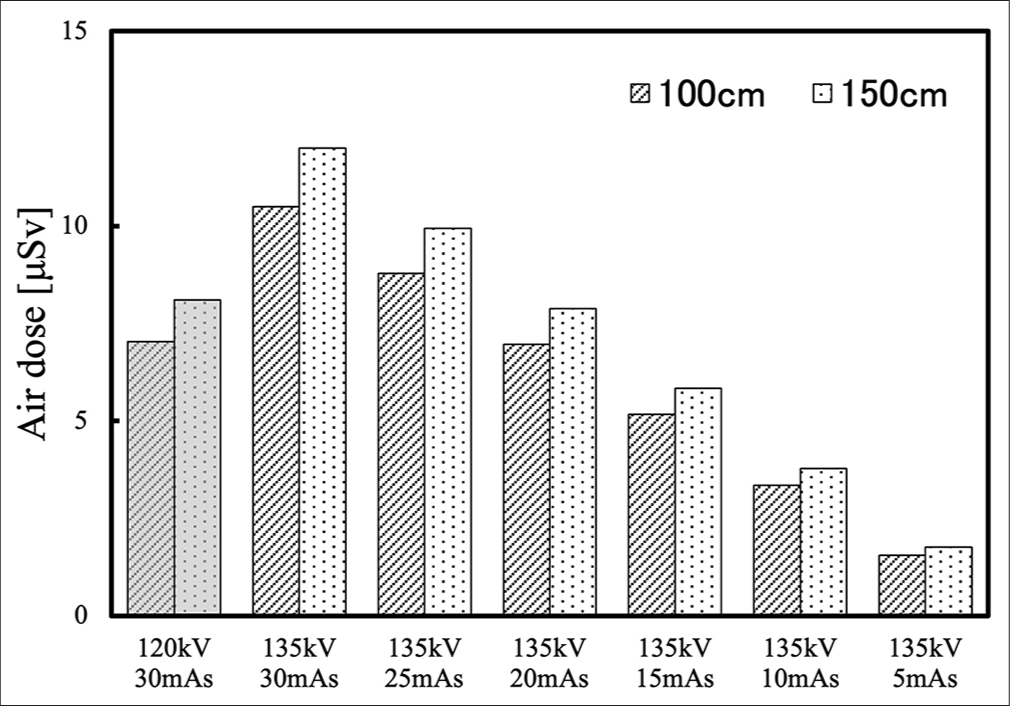
- Results of air dose at 100 and 150 cm high at a point 60 cm from the puncture site, assuming that the operator stood during the procedure.
| Condition | ESD (mGy) | Change rate (%) | Air dose (100 cm) (μSv) | Change rate (%) | Air dose (150 cm) (μSv) | Change rate (%) |
|---|---|---|---|---|---|---|
| 120kV 30mAs | 19.4 | 7.03 | 8.10 | |||
| 135kV 30mAs | 26.1 | 134.9 | 10.50 | 149.4 | 12.00 | 148.1 |
| 135kV 25mAs | 22.1 | 114.2 | 8.78 | 124.4 | 9.94 | 122.7 |
| 135kV 20mAs | 17.5 | 90.3 | 6.97 | 99.1 | 7.88 | 97.3 |
| 135kV 15mAs | 12.8 | 66.1 | 5.17 | 73.5 | 5.84 | 72.1 |
| 135kV 10mAs | 8.7 | 45.1 | 3.35 | 47.7 | 3.78 | 46.7 |
| 135kV 5mAs | 4.2 | 21.6 | 1.55 | 22.0 | 1.76 | 21.7 |
ESD: Entrance surface dose
Figure 9 shows a phantom image of the biopsy needle, and Figure 10 shows the results of the visual assessment.
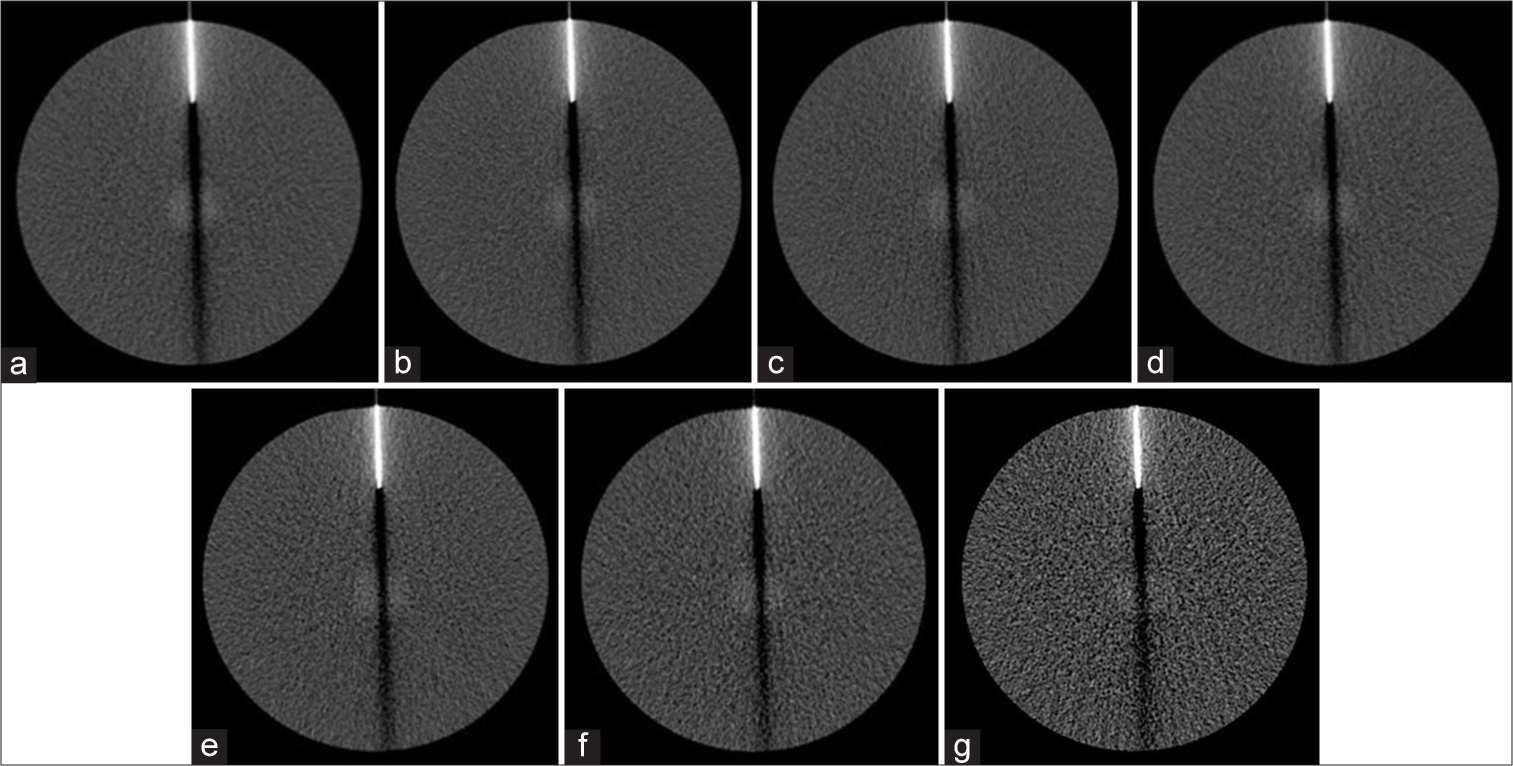
- Phantom images with biopsy needle in each scan condition. (a) Recommend condition, (b) 135kV 30mAs, (c) 135kV 25mAs, (d) 135kV 20mAs, (e) 135kV 15mAs, (f) 135kV 10mAs, and (g) 135kV 5mAs.
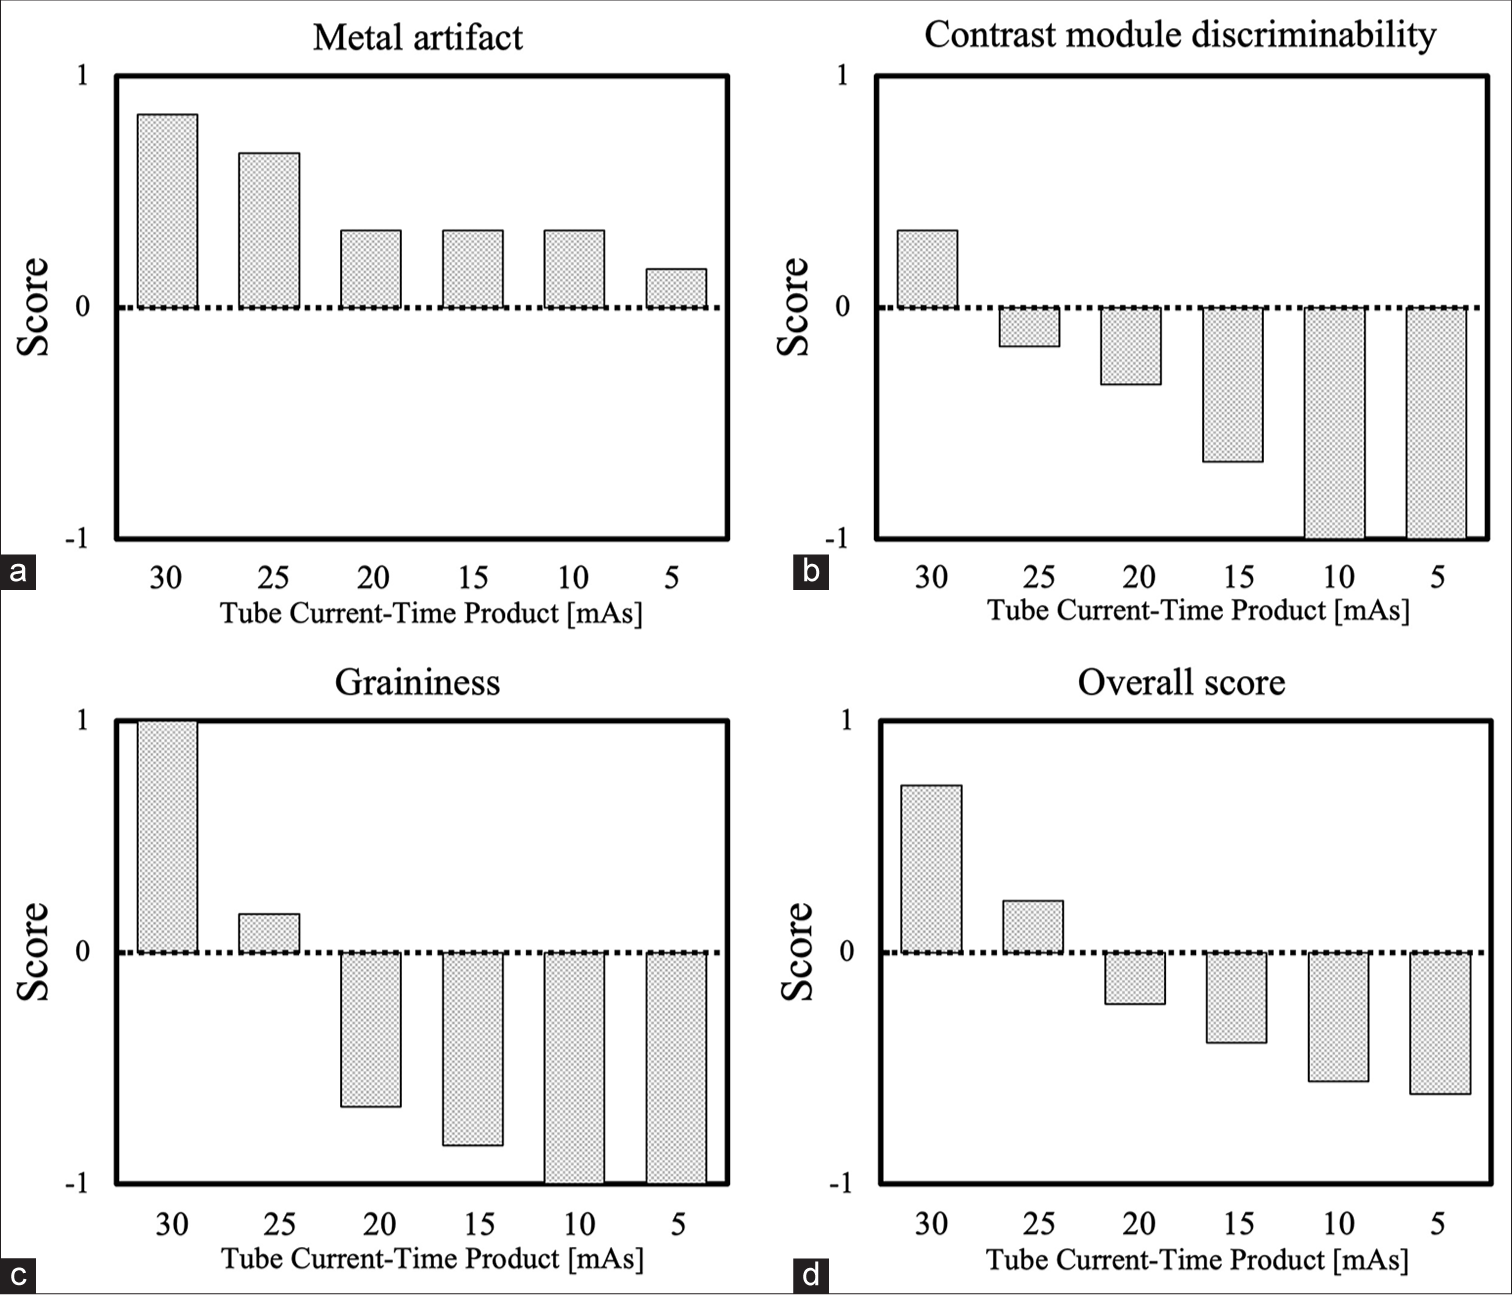
- Results of visual assessment. (a) Score of metal artifact, (b) score of contrast module discriminability, (c) score of graininess, and (d) score of overall.
The number of metal artifacts exceeded the recommended conditions under all high-tube voltage conditions, contrast module discriminability at 30 mAs, and image graininess at 30 mAs and 25 mAs. Furthermore, the score exceeded the recommended value of 25 mAs or higher.
DISCUSSION
Although imaging conditions of 120 kV and 30 mAs or less are recommended for CT fluoroscopy during CT-guided biopsy, we hypothesized that a high-tube voltage and low tube current time product would reduce metal artifacts caused by the biopsy needle and patient and operator exposure. In the present study, a phantom study was therefore conducted as a preliminary investigation to evaluate the potential benefits of high-tube voltage conditions.
The AI values for the high-tube voltage condition were significantly lower than those for the recommended condition, indicating that using the high-tube voltage condition reduces metal artifacts. In general, the higher the tube voltage, the higher the X-ray energy and the smaller the difference in tissue attenuation coefficients, thereby reducing streak artifacts caused by tissue absorption differences. This is believed to be the reason for the lower AI values observed in this study, which is consistent with the results of previous reports.[16,17]
It is expected that a decrease in contrast will occur as the X-ray energy increases, given that the proposed conditions use a tube voltage higher than the recommended conditions. The CNR for the high-tube voltage condition is not significantly different from that of the recommended condition between 30 and 25 mAs, but is significantly lower at 20 mAs or less. At 20 mAs, where the CTDIvol is almost the same, it is approximately 13% lower than the recommended conditions. However, because CT fluoroscopy uses a low dose of approximately one-tenth that of a conventional CT scan, the original image quality is poor. Therefore, the next step should be to use clinical imaging to assess whether a reduction in CNR affects the procedure.
The ESD and air dose decreased in proportion to the tube current-time product under high-tube voltage conditions. Compared to the recommended conditions, ESD was reduced by 9.7% at 20 mAs, air dose at 100 cm was reduced by 0.7%, air dose at 150 cm was reduced by 2.7%, and increased at higher tube current-time products. The lower ESD value can be attributed to the lower X-ray dose associated with the lower tube current. It is expected that the lower reduction in air dose compared with ESD is due to the use of a higher tube voltage. As the tube voltage increases, Compton scattering accounts for a more significant proportion of the dose in the diagnostic X-ray region, thereby increasing the scattered radiation. The effects of low tube current and high-tube voltage cancel each other out, resulting in a lower reduction ratio of the air dose compared to ESD. In any case, the ESD and air dose were lower than the recommended conditions at 20 mAs, where the CTDIvol was almost the same, suggesting that high-tube voltage conditions help reduce exposure. Although the reductions in ESD and air dose per second of fluoroscopy time are relatively modest (0.38 mGy and 0.01–0.04 μSv, respectively), the longer the procedure time, the greater the effect. Previous reports have indicated that the average CT fluoroscopy time for biopsy procedures is 40–90 s.[18,19] Consequently, the reduction in exposure during the procedure was expected to be significant.
In the context of visual assessment, metal artifacts were found to be superior under all high-tube voltage conditions. The contrast module discriminability and image graininess were slightly better at 30 and 25 mAs, respectively. This finding aligns with the results of the physical evaluation. While high-tube voltage conditions are beneficial for reducing metal artifacts, low-contrast detectability was visually demonstrated to be reduced. Regarding the overall score, 25 mAs exceeded the recommended conditions, whereas the equivalent score was between 25 and 20 mAs. The equivalent range of the CTDIvol for the recommended and high-tube voltage conditions is 25–20 mAs, and the physical and visual properties are partially dependent on the scan dose.
This study had several limitations. First, only the pelvic region was studied, not the entire body. Second, only a single IVRCT system was used. Third, a phantom study was conducted rather than a human subject. The results of this study cannot be applied to chest CT fluoroscopy because the recommended conditions for this procedure are 120 kV and 10 mAs. Furthermore, this study did not examine the minimum image quality required for the procedure; instead, it focused on high-tube voltage conditions equivalent to the recommended conditions (120 kV, 30 mAs) for the pelvic region. During the actual procedure, setting appropriate conditions in consultation with the operator is essential, considering the target area and the patient’s physique. It is also important to note that there are differences in tube voltages that can be set for different IVR-CT systems. Therefore, it is necessary to consider the appropriate high-tube voltage conditions for each system. Although this study was limited by its use of phantoms, the results suggest that high-tube voltage conditions in CT fluoroscopy may reduce metallic artifacts and reduce operator and patient exposure. Clinical evaluation is recommended to corroborate these results.
CONCLUSION
The findings of this study indicated that high-tube voltage conditions may be beneficial for CT fluoroscopy during CT biopsy procedures.
Acknowledgment
We express our profound gratitude to our research partners for their invaluable collaborations.
Ethical approval
The Institutional Review Board approval is not required as it is a phantom study.
Declaration of patient consent
Patient’s consent was not required as there are no patients in this study.
Conflicts of interest
There are no conflicts of interest.
Use of artificial intelligence (AI)-assisted technology for manuscript preparation
The authors confirm that there was no use of artificial intelligence (AI)-assisted technology for assisting in the writing or editing of the manuscript and no images were manipulated using AI.
Financial support and sponsorship: This study was supported by a 2023 research grant from the Kanto Branch of the Japanese Society of Radiological Technology.
References
- Value of CT fluoroscopy for percutaneous biopsy procedures. J Vasc Interv Radiol. 2000;11:879-84.
- [CrossRef] [PubMed] [Google Scholar]
- CT fluoroscopy-guided abdominal interventions: Techniques, results, and radiation exposure. Radiology. 1999;212:673-81.
- [CrossRef] [PubMed] [Google Scholar]
- Real-time CT-fluoroscopy for guidance of percutaneous drainage procedures. J Vasc Interv Radiol. 1998;9:735-40.
- [CrossRef] [PubMed] [Google Scholar]
- Percutaneous abdominal and pelvic interventional procedures using CT fluoroscopy guidance. AJR Am J Roentgenol. 1999;173:637-44.
- [CrossRef] [PubMed] [Google Scholar]
- Guidance with real-time CT fluoroscopy: Early clinical experience. Radiology. 1996;200:851-6.
- [CrossRef] [PubMed] [Google Scholar]
- Benefits and safety of CT fluoroscopy in interventional radiologic procedures. Radiology. 2001;219:515-20.
- [CrossRef] [PubMed] [Google Scholar]
- Normalized metal artifact reduction (NMAR) in computed tomography. Med Phys. 2010;37:5482-93.
- [CrossRef] [PubMed] [Google Scholar]
- Dual-energy CT-based monochromatic imaging. AJR Am J Roentgenol. 2012;199(5 Suppl):S9-15.
- [CrossRef] [PubMed] [Google Scholar]
- Robotic needle insertion during computed tomography fluoroscopy-guided biopsy: Prospective first-inhuman feasibility trial. Eur Radiol. 2020;30:927-33.
- [CrossRef] [PubMed] [Google Scholar]
- Robotically driven interventions: A method of using CT fluoroscopy without radiation exposure to the physician. Radiology. 2002;225:277-82.
- [CrossRef] [PubMed] [Google Scholar]
- Standardization in X-ray CT imaging-galactic. (2nd ed). Kyoto: Japanese Society of Radiological Technology; 2015. p. :127-8. In Japanese
- [Google Scholar]
- Application of the noise power spectrum in modern diagnostic MDCT: Part I. Measurement of noise power spectra and noise equivalent quanta. Phys Med Biol. 2007;52:4027-46.
- [CrossRef] [PubMed] [Google Scholar]
- CT measure. 2012-2014. Hiroshima: Japanese Society of CT Technology; Available from: https://www.jscttech.org [Last accessed on 2025 Jan 07]
- [Google Scholar]
- High-definition CT gemstone spectral imaging of the brain: Initial results of selecting optimal monochromatic image for beam-hardening artifacts and image noise reduction. J Comput Assist Tomogr. 2011;35:294-7.
- [CrossRef] [PubMed] [Google Scholar]
- Metal artifacts reduction using monochromatic images from spectral CT: Evaluation of pedicle screws in patients with scoliosis. Eur J Radiol. 2013;82:e360-6.
- [CrossRef] [PubMed] [Google Scholar]
- Suggestion of the relative artifact index for noise-independent evaluation of the streak artifact. Nihon Hoshasen Gijutsu Gakkai Zasshi. 2018;74:315-25.
- [CrossRef] [PubMed] [Google Scholar]
- Value and clinical application of orthopedic metal artifact reduction algorithm in CT scans after orthopedic metal implantation. Korean J Radiol. 2017;18:526-35.
- [CrossRef] [PubMed] [Google Scholar]
- Guidance of percutaneous pulmonary biopsies with real-time CT fluoroscopy. Eur J Radiol. 2002;42:74-9.
- [CrossRef] [PubMed] [Google Scholar]
- CT fluoroscopy-guided lung biopsy versus conventional CT-guided lung biopsy: A prospective controlled study to assess radiation doses and diagnostic performance. Eur Radiol. 2011;21:232-9.
- [CrossRef] [PubMed] [Google Scholar]