Translate this page into:
Optimizing low contrast volume thoracic CT angiography: From the basics to the advanced

*Corresponding author: Katherine Kaproth-Joslin, Department of Imaging Sciences, University of Rochester, United States. katherine_kaproth-joslin@urmc.rochester.edu
-
Received: ,
Accepted: ,
How to cite this article: Kaproth-Joslin K, Hobbs S, Rajiah P, Chaturvedi A, Chaturvedi A. Optimizing low contrast volume thoracic ct angiography: From the basics to the advanced. J Clin Imaging Sci 2022;12:41.
Abstract
Contrast-enhanced CT angiography (CTA) is a widely used, noninvasive imaging technique for evaluating cardiovascular structures. Contrast-induced nephrotoxicity is a concern in renal disease; however, the true nephrotoxic potential of iodinated contrast media (CM) is unknown. If a renal impaired patient requires CTA, it is important to protect the kidneys from further harm by reducing total iodinated CM volume while still obtaining diagnostic quality imaging. These same reduced volume CM techniques can also be applied to nonrenal impaired patients in times of CM shortage. This educational review discusses several modifications to CTA that can be adapted to both conventional 64-slice and the newer generation CT scanners which enable subsecond acquisition with a reduced CM volume technique. Such modifications include hardware and software adjustments and changes to both the volume and flow rate of administered CM, with the goal to reduce the dose of CM without compromising diagnostic yield.
Keywords
Contrast media
Reduced volume
Test bolus
Bolus tracking
Computed tomography angiography

INTRODUCTION
The use of iodinated contrast media (CM) is a relative contraindication in the setting of chronic kidney disease, which has an estimated global prevalence of 11-13%.[1,2] This is due to the risk of contrast-induced acute kidney injury (CI-AKI), which refers to any AKI occurring within 48 hours after administration of CM. CI-AKI is a subset of AKI, where the drop in renal function can be causally linked to CM (previously called-contrast-induced nephropathy), however recent studies have shown that a substantial percentage of AKI after CM administration is not attributed to CM itself.[3] Nevertheless, many continue to believe that CI-AKI remains a real concern and existing guidelines should not be changed.[4] In a recent multicenter study in Taiwanese patients with an estimated glomerular filtration rate (eGFR) of less than 30 mL/min/1.73 m2GFR, contrast-enhanced CT was associated with higher risk of acute kidney injury and further hemodialysis.[5] Hence, it appears prudent to use a low amount of iodinated CM in patients with severe renal insufficiency.
The goal of this review article is to describe techniques useful for reducing the dose of iodinated CM, particularly in patients with renal dysfunction (eGFR of less than 30 mL/min/1.73 m2). These techniques may also be used in the routine/urgent setting where the GFR is not known, in patients with low body mass index (<23 kg/m2), and in times when CM supply is limited.[6,7] This is especially important currently given the disruption of the CM supply chain causing significant shortages in CM within the United States and globally during the Spring of 2022.[8] The total amount of iodinated material that is needed for imaging is determined by a combination of several factors, including the concentration of the iodinated CM, the total volume of CM used, the rate the CM is injected, the length of time the CM is injected, and the length of time the scanner requires to complete imaging. Any modifications to these factors results in changes to the amount of iodinated material used. Using a fast scanner with short scan times is the most obvious approach, but not always an option at all institutions and at all sites within the same institution. We describe several basic techniques of adjusting the CM bolus and CT scanning parameters which can be performed on any scanner to reduce the volume of CM needed to produce diagnostic images. Some of the techniques, including a low kVp imaging have the additional advantage of lowering the lower radiation dose.[9]
Modification of the iodinated CM injection
Modifying the CM concentration and injection rate
Traditionally, CTA is performed with undiluted iodinated CM at a standard intravenous injection rate followed by a saline chaser. The saline bolus is important to both flush the injection line and to keep the CM injection bolus tightly grouped in the vessel, reducing its dilution within the blood pool. One simple method to reduce iodine load is to blend undiluted CM with saline prior to injection. This blended CM solution can either be used for the total length of the CM injection or as a portion of the total CM injection (e.g., 25 mL of undiluted CM followed by 50 mL of a 50/50 blend of CM and saline for a total volume of 50 mL of CM in an injection volume of 75 mL).[10,11] While this contrast blend may somewhat reduce the opacification of the target vessel as compared to nondiluted contrast, the decrease is typically not diagnostically significant. Overall, this contrast blend can reduce the total volume of CM used during imaging and/or prolong the duration of the injection if needed. Successful CTA for imaging of the aorta and pulmonary arteries has been described using 80/20 and 70/30 CM/saline blends [Figure 1].[10,11]
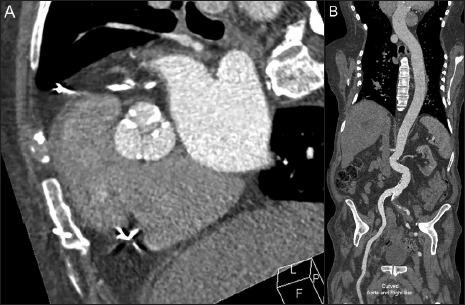
- 91-year-old male with aortic stenosis presenting for preprocedure planning for transcatheter aortic valve replacement using an iodinated contrast-saline blend to reduce the overall volume of contrast utilized in this study. 44 mL of an 80% iodinated contrast* and 20% saline blend was injected at a rate of 4 mL/second followed by 40 mL of saline at the same rate, using a total contrast volume of 35 mL of contrast. Imaging consisted of a contrast-enhanced retrospective ECG-gated CTA performed over the heart (A) followed immediately by a second, a non- ECG-gated high-pitch axial acquisition from the neck base through the pelvis. Figure B Demonstrates the enhancement of the aorta during the second non-ECG gated imaging acquisition using a curved reformat of the aorta and right iliac artery. Contrast enhancement of the aorta was diagnostic in both studies. *Concentration of iodinated contrast was 350 mg iodine/mL.
Reducing the CM flow rate is another method that useful to prolong the CM bolus and reduce the overall volume of CM needed. It is important to note however that lowering the CM flow rate below 3 mL/sec may produce suboptimal images due to dilution of CM in the blood pool, leading to decreased opacification of the target vessels[12] This technique is useful for imaging aorta and its branch vessels but suboptimal for imaging the distal pulmonary arteries [Figure 2, supplemental digital content 1]. There should be no alteration to the standard saline chaser volume or rate in either of the above CM injection modifications. The purpose of the saline chaser volume is to keep the CM injection tightly grouped.

- 51-year-old female presenting to the emergency department with chest pain and shortness of breath. Double rule out CTA study for acute aortic syndrome (AAS) and pulmonary embolus was performed employing both a reduced contrast media flow rate and an iodinated contrast blend to reduce overall contrast volume. 45 mL of an 80% iodinated contrast* and 20% saline blend was injected at a rate of 3.5 mL/ second followed by 30 mL of saline at the same rate, for a total contrast volume of 41 mL of contrast. Imaging consisted of a contrast-enhanced CTA optimized for imaging of the aorta and pulmonary arteries. Axial image demonstrates diagnostic enhancement of both the aorta and the pulmonary arteries. A dissection flap (arrow) is clearly seen in the aortic arch. *Concentration of iodinated contrast was 350 mg iodine/mL.
The total volume of contrast needed for injection is dependent on both the rate (mL/sec) that the contrast is being injected at and how much time the scanner needs to image the area of interest, including the amount of time it takes for the scanner to begin diagnostic imaging after the study is initiated (nonmodifiable/intrinsic to the scanner), any preprogrammed delay such as for visceral enhancement (modifiable), and the actual time the scanner needs to move through the Z-axis of imaging (semimodifiable). As the lowest rate recommended for contrast injection for angiographic imaging is 4 mL/sec, modifications that can reduce scan time can have a significant impact on the amount of contrast volume needed for imaging, to be discussed below.
Modifying the method of CM injection
Estimation of CM arrival in the target vessel is calculated by using test-bolus or bolus-tracking technique. Traditionally the duration of the CM injection needs to also account for the time (physiological minimum) it takes for the cardiopulmonary system to disperse the CM, typically at least one-half of the scan duration.[13]
Modifying test-bolus technique to reduce CM volume
In a traditional test-bolus method, two separate CM injections are performed. The first injection is considered nondiagnostic, known as a test bolus, and is used to identify the time of arrival of CM in the target vessel, traditionally using 10-20 mL of CM followed by saline flush. Subsequently, multiple low-radiation-dose sequential images are acquired at a fixed scan level over the target vessel and a time-enhancement curve is obtained by measuring the enhancement within a region of interest (ROI) placed over a target vessel [Figure 3]. The delay time for the diagnostic portion of the CTA is then determined from the time to peak CM enhancement. An additional delay is commonly added to the calculated time to peak enhancement (considered a diagnostic delay), slightly deferring the start of the diagnostic CTA to maximize CM enhancement.[14,15] The test bolus and diagnostic bolus are both injected at the same flow rate, with the assumption that the time to peak enhancement will occur at a similar time point for each injection. Importantly, the 10-20 mL of CM in the test bolus is used to identify the CM arrival time only and is not used for the diagnostic portion of the acquisition.

- 94-year-old female with aortic stenosis presenting for pre-procedure planning for transcatheter aortic valve replacement using a test bolus technique. 10 mL of undiluted iodinated contrast* was injected at a rate of 3.5 mL/second followed by 20 mL of saline. Subsequently multiple low-radiation-dose sequential images were acquired at a fixed scan level over the aorta and pulmonary artery demonstrating the progression of contrast from the SVC (A) to the pulmonary artery (B) and finally to the thoracic aorta (C). (D) Time-attenuation curve(s) are then obtained from the test bolus to determine the arrival time contrast in target vessel(s). (Pulmonary artery =1, ascending aorta =2, descending aorta =3). *Concentration of iodinated contrast was 350 mg iodine/mL.
The volume of CM used in the first (nondiagnostic) injection of the test-bolus method can be reduced by using 8-10 mL of a 50/50 CM saline blend, therefore only using a total of 4-5 mL of CM to determine the CM arrival time [Figure 4].[10] In our experience, if the target vessel is known to be enlarged or aneurysmal, peak CM attenuation calculation should be performed over the aneurysmal portion to minimize the effect of contrast mixing artifact. Opacification for the target vessel such as the thoracic aorta can be challenging in patients with heart failure if the time of arrival is performed only over the ascending aorta as the CM arrival in descending thoracic aorta can be delayed [Figure 5].[16] In such cases, it may be useful to choose the target vessel in a more distal location such as descending thoracic aorta for carotid CTA to make sure the target vessel of interest is well opacified during imaging. This is especially important when performing a double rule-out study (CTA for Pulmonary Embolus and thoracic aorta) traditionally triggered from the left atrium.

- A 51-year-old female presenting to the emergency department with chest pain and shortness of breath. Test bolus technique utilizing a contrast blend was used to identify peak enhancement curves in the aorta and pulmonary artery during a low contrast dose double rule out CTA study for acute aortic syndrome (AAS) and pulmonary embolus (same patient from figure 2). 10 mL of an 50% iodinated contrast* and 50% saline blend was injected at a rate of 3.5 mL/second followed by 4 mL of saline, for a total contrast volume of 5 mL of contrast. Subsequently multiple low-radiation-dose sequential images were acquired at a fixed scan level over the aorta and pulmonary artery and a time-enhancement curve was obtained by measuring the enhancement within the target vessels of interest. Peak enhancement within the pulmonary artery was identified at 4.57 sec, the ascending aorta at 11.1 sec, and the descending aorta at 11.76 sec. The diagnostic portion of the study (see figure 2), consisting of a contrast-enhanced retrospective ECG-gated CTA performed over the heart was performed with a 12-second delay based on these times. *Concentration of iodinated contrast was 350 mg iodine/mL.

- 89-year-old male with aortic stenosis presenting for pre-procedure planning for transcatheter aortic valve replacement with imaging demonstrating delayed transit time of the contrast bolus in the setting of heart failure. A test bolus technique utilizing undiluted contrast was used to identify peak enhancement curves in the pulmonary artery, ascending aorta, and descending aorta during CTA study for pre-procedure planning for transcatheter aortic valve replacement. 10 mL of undiluted iodinated contrast* was injected at a rate of 4 mL/second followed by 20 mL of saline. Subsequently multiple low-radiation-dose sequential images were acquired at a fixed scan level over the aorta and pulmonary artery (A) and a time-enhancement curve was obtained by measuring the enhancement within the target vessels of interest (B). Peak enhancement within the pulmonary artery was identified at 16 sec, the ascending aorta at 34 sec, and the descending aorta at 40 sec. The patient had a calculated left ventricular ejection fraction 22% during imaging acquisition. Note the delayed transit time between both the peak maximal enhancement between the pulmonary artery and the aorta as well as the ascending aorta and descending aorta. A more normal physiologic delay is seen in figure 3. (Pulmonary artery =1, ascending aorta =2, descending aorta =3). *Concentration of iodinated contrast was 350 mg iodine/mL.
Modifying bolus-tracking technique to reduce CM volume
In this method, a single intravenous injection of CM is delivered at a constant flow rate to trigger the start of the study and subsequently obtain diagnostic images. Low radiation dose nondiagnostic sequential images are acquired at a fixed scan level over the reference slice after an ROI is placed on the target vessel. CM enhancement within the ROI is measured automatically during these sequential images and once a predetermined Hounsfield unit (HU) threshold is reached, the diagnostic scan is initiated [Figure 6, supplemental digital content 2]. There is an inherent time delay from the point the HU threshold is reached to the time the diagnostic imaging acquisition begins. This is due to the gantry transit time present on most scanners, accounting for the time it takes for the gantry to reposition from the level where the reference scan was acquired to the start location of the diagnostic scan. In addition, there is often a preprogrammed diagnostic delay added to this gantry transit time to promote visceral organ enhancement. Post threshold delay time, therefore, refers to the amount of time it takes for the CT scanner to begin imaging once the threshold CM enhancement trigger has been reached. This delay is usually due to table movement from the location of the bolus tracking to the location at which the diagnostic image acquisition begins. During this time delay, CM continues to be administered to the patient, however diagnostic images are not being obtained. On most scanners, the minimum delay time is 4-4.5 sec. There will be additional time needed for the scanner to move from the location of ROI selected for the bolus tracking threshold to the first slice of acquisition. This provides us with two parameters that can be modified: location of the ROI and enhancement threshold to trigger the scan.

- A 74-year-old female presenting to the emergency department with hypoxia and syncope and a clinical concern for pulmonary embolism. Pulmonary angiography was performed using a bolus tracking technique. 40 mL of undiluted iodinated contrast* was administered at 4.0 mL/sec followed by 50 mL of saline at the same rate. An ROI was placed on the main pulmonary artery and diagnostic imaging was triggered once a threshold of 150 HU was reached. Non-ECG-gated high-pitch axial images were obtained from the neck base through the diaphragm. Axial MPR images demonstrate diagnostic opacification of the pulmonary artery. Please note that this patient was of large body habitus (>130 kg). *Concentration of iodinated contrast was 350 mg iodine/mL.
Location of ROI
Changing the position of the ROI to a vessel located upstream from the target vessel of interest can decrease the overall amount of CM needed to perform the diagnostic portion of imaging. In a study performed using 30 mL of CM injected at a rate of 5 mL/s for pulmonary artery CTA using a 64-slice scanner, Wu et al. showed that the superior vena cava can be used to initiate the scan rather than the more commonly used location of the main pulmonary artery.[17] Once the threshold is triggered in the upstream vessel, the start of diagnostic imaging is delayed by adding a predetermined post threshold delay to account for the extended CM transit time from this proximal location to the target vessel at the time of scan initiation. Using this technique allows the diagnostic portion of the scan to be triggered before the CM reaches the target vessel and ensures CM has reached the target vessel when the diagnostic images are being acquired [Figure 7]. This technique is best utilized in patients with normal cardiac function. In patients with decreased cardiac function (i.e., congestive heart failure or severe aortic stenosis) the predetermined CM transit time may be significantly delayed, leading to improper bolus timing.

- 55-year-old female presenting with chest pain post operatively with a clinical concern for acute aortic syndrome. The bolus tracking method was modified by changing the location of the ROI to an upstream target. 70 mL of iodinated contrast* was injected at a rate of 4 mL/second followed by 50 mL of saline at the same rate, for a total contrast volume of 70 mL of contrast. (A) The ROI was placed on the pulmonary artery as the upstream target for CT angiographic imaging of the aorta. Coronal (B) image demonstrate diagnostic enhancement of the aorta. *Concentration of iodinated contrast was 350 mg iodine/mL.
Decreasing the enhancement threshold
A triphasic CM injection method can be used to lower the total amount of CM needed for imaging. Using this method, a 50/50 CM saline blend is injected at the same flow rate (3-4 mL/sec) in order to identify the arrival of CM in the target vessel.[10,16] Duration of such a blended injection is kept equal to the duration of the post threshold delay time. This is followed by the second phase of 80/20 CM-saline blend or undiluted CM at a regular flow rate and then flushed in the third phase with a saline chaser at the same flow rate. As the low flow rate 50/50 blend injected is typically insufficient to trigger the traditional bolus tracking threshold (i.e., 150 HU for a pulmonary CTA), the scan is manually initiated once the CM upslope is identified on the time attenuation curve [Figure 8, supplemental digital content 3].[17] The duration of this second phase is kept equal to the CT acquisition time for diagnostic imaging. This technique relies on the knowledge that by the time the actual diagnostic acquisition begins (in the setting of a minimal post threshold delay time), the higher attenuation blended or undiluted CM will be present in the vessel due to the second phase of this triphasic injection.

- 84-year-old female presenting to the emergency department after an unwitnessed fall and acute blood loss anemia with a concern for acute aortic injury. CT angiography imaging of the aorta was performed following modification of the bolus tracking method using a triphasic contrast injection and decreasing the enhancement threshold to reduce the total iodinated contrast volume. The first phase of injection consists of 10 mL of a 50% iodinated contrast* and 50% saline blend which was administered at a low flow rate of 2 mL/sec in order to identify the arrival of contrast in the target vessel (aorta). This was followed by the second phase injection consisting of 15 mL undiluted iodinated contrast administered at a rate of 2.5 mL/sec. Finally, the third phase of the injection consists of a 50 mL saline chaser administered at a rate of 3 mL/sec. A total of 20 mL of iodinated contrast was used in this imaging. (A) As the low flow rate and volume of the 50/50 blend in the initial phase of imaging is typically insufficient to trigger the traditional automated bolus tracking threshold (i.e. 150 HU for a pulmonary CTA), the scan is manually initiated once the contrast upslope is identified on the time attenuation curve. (B) Axial image demonstrates diagnostic opacification of the thoracic aorta and clear visualization of the aneurysmal dilatation of the aortic arch. *Concentration of iodinated contrast was 350 mg iodine/mL.
Modifying diagnostic scan delay
As mentioned above, there is a commonly added diagnostic delay in both the test bolus and bolus tracking methods. This diagnostic delay is useful to improve the enhancement of visceral organs (i.e., liver), however, this increased visceral enhancement is not always important in CT angiographic imaging if contrast volume is a concern. Therefore, as the clinical question in CTA is focused on the vessels (i.e., aorta, pulmonary vein or pulmonary artery), this added diagnostic delay and its associated volume of CM could potentially be eliminated therefore reducing the overall amount of CM needed in the study.[10,17] This is a modifiable time on most scanners and can be adjusted to the lowest possible time if the patient requires low contrast volume.
Modifications to image acquisition
Any technique that increases the speed in which the diagnostic images can be obtained will decrease the length of time that CM needs to be injected, therefore overall lowering the amount of CM needed for imaging. Options include adjusting the pitch, collimation, and rotation time of the CT scanner [see Table 1 for a summary].
| Collimation | Pitch | Gantry rotation time (Sec) | Scan delay time (Sec) | Total scan time (Sec) | |
|---|---|---|---|---|---|
| 64-slice Standard | 64 × 0.625 | 0.61 | 0.4-0.75 | 4.2 | 6-9.5 |
| 256 slice | 2 × 128 × 0.625 | 0.60-0.9 | 0.27-0.40 | 4.2 | 2-3.4 |
| Dual source | 2 × 128 × 0.625 | 1.5-3.2 | 0.28 | 6.0 | 1.1-1.7 |
Pitch
Pitch is defined as table distance traveled in one 360°gantry rotation divided by beam collimation.[18] The default pitch on a single source 64 detector CT scanner for CTA is between 0.7-1. A pitch of 1.0 indicates no overlap or gap in the acquisition and can be useful when performing fast scans. Changing pitch from 0.7 to 1 on such a scanner can decrease the scan time by up to 4 seconds. It is important to note that there is variability between different vendors on how much this factor can be modified. For low CM dose imaging using a high pitch is recommended to decrease scan times.
Collimation
Collimation represents the width of the x-ray beam used during CT scanning and is the product of the number of detectors used and the effective detector row thickness.[19] In a 64-slice scanner with a 0.5 mm detector, this equates to beam collimation of 32 mm in thickness. The publications on low CM volume CTA recommend using the widest collimation available on the scanner.[2,10,11,16,17]
Rotation time
This represents the time taken for one full rotation of the gantry. Faster rotation time decreases the overall scan time and improves temporal resolution but places more dynamic stress on the gantry structure.[20] As a faster scan means less CM volume is needed, therefore for low CM volume CTA, the lowest rotation time available on the scanner should be used. Changing from a default of 0.7-0.4 seconds for rotation time decreases the scan time by up to 4 seconds on a conventional 64-slice CT. Conversely, the rotation time on a dual-energy CT is more (0.5 sec) on the older dual-energy scanners than the single-energy dual-source acquisition on the same scanner (0.28-0.35 sec). This increased acquisition time should be kept in mind when performing dual-energy scans on these dual-source scanners and the CM bolus should be prolonged accordingly.
Kilovoltage (kVp) and mAs
The utility of lowering the kVp used to generate a CTA is based on the usefulness of imaging at an energy close to the K-edge of Iodine to improve CM conspicuity and increase the attenuation of iodinated CM.[21,22] CTA performed at low kVp, therefore results in higher attenuation in the aorta with an overall reduced radiation dose but also leads to increased image noise. One study showed that it was possible to reduce the CM volume in a CTA by 25% by scanning at 70-kVp using a high-pitch technique with the same diagnostic accuracy as compared with standard 120-kVp and standard volume of CM.[23] Another study showed that low tube voltage 80 kVp CTA using 50 mL of CM has the same diagnostic quality as a 120 kVp CTA using 100 mL of CM.[24] Patient body weight can use to determine the optimal kVp and CM volume that can be used to obtain diagnostic image quality.[25] Due to increased image noise, lower kVp acquisitions may need to involve increasing the mAs by the automatic tube current modulation of the scanner to improve the photon flux at the detectors. The use of iterative reconstruction can decrease the radiation dose.[23]
Advances in hardware
Scan time is reduced on newer scanners such as a dual source or a wide detector row volume scanner.
Wide-detector/volume scanners
With wide-detector/volume scanners, Z-axis coverage of up to 8 cm (128 detector row single source, dual focal spot) or 16 cm (320 detector row, single source, single focal spot) can be obtained with one gantry rotation.[26,27] Only a low volume of CM is required with these scanners since CM is required only for a short period of time. Additional advantages of these techniques include low motion and radiation doses. Due to low motion, high-quality images of the aortic root, aortic valve, and coronary arteries can be obtained without ECG gating.[2,28]
High-pitch helical acquisition
An ultra-fast high-pitch helical mode, that is, Flash mode, is available in the latest generation of dual-source scanners. On a second-generation dual-source scanner, a high pitch acquisition with pitch up to 3.2 is possible, leading to a sub-second acquisition time for a typical 280 mm Z-axis coverage for a thoracic CTA.[29] On the third generation dual-source CT, a pitch of 3.0 in non-ECG gated and 3.4 in ECG gated mode is possible. The expected gaps in data with high-pitch mode are filled by information from the second x-ray tube. These images can be obtained either with or without ECG gating.[30] The ultra-fast acquisition means that CM is required only for a short period of time, which allows the use of a low dose of CM.[31,32] Additional benefits include- lower radiation dose and reduced motion artifacts. CM savings of up to 51% have been demonstrated, with the use of only 20 mL of CM.[10]
Multi-energy CT scanners
Multi-energy CT scanners provide attenuation characteristics of tissues across a spectrum of X-ray energies. There are several technologies, which can be either at the source level (dual-source, dual-spin, rapid kVp switching, twin beam) or at the detector level (Dual-layer, photon counting).[33-36] One of the types of images that can be generated with this technology is a virtual monoenergetic image (VMI) which mimics images obtained at a single energy level. VMI at low energies, that is, <70 keV has the high signal of iodinated CM due to higher photoelectric attenuation. This allows the use of low dose of iodinated CM.[37] This has been demonstrated in multiple vascular beds achieving as much as 70 % reduction of CM load, with iodine dose as low as 15 g and CM volume as low as 25 mL.[38,39] Optimal energy levels in these studies range from 40-60 keV.[40] Higher noise was a limitation of using these low energy levels, but the advent of noise-optimized algorithms allows the use of low energy levels without compromising diagnostic accuracy.[41] The tube rotation may be longer in the dual-energy mode in some scanners; therefore CM injection time may need to be prolonged. In such situations, acquisitions can be performed by decreasing the CM flow rate or by using an 80/20 CM saline blend to increase the overall volume and duration of injection to account for the longer scan time. Newer third-generation dual-source CT scanners have a rotation time of 0.28 seconds and can cover the normal 30 cm Z-axis coverage for a thoracic scan in under 1 sec; thus this is not an issue with the lower CM volumes.[42] Spectral CT can be used to reduce image noise and CM volume.[43]
Modification of patient-dependent parameters
Breath-hold coaching
Image acquisition during thoracic CTA usually involves a breath hold before acquisition begins. Unfortunately, if the patient performs a deep breath-hold similar to the Valsalva maneuver, increased unpacified blood from the inferior vena cava comes into the right heart. Known as transient interruption of CM bolus, this process can lead to mixing artifacts and decreased opacification of the target vessels of interest, most commonly occurring during pulmonary artery CTA [Figure 9]. This problem can be mitigated by coaching the patient with breathing instructions (i.e., stop breathing wherever they are in the respiratory cycle or take a shallow breath prior to imaging if they cannot stop breathing) or by performing these scans free breathing if necessary.[44]

- 65-year-old-male presenting with chest pain with a clinical concern for acute pulmonary embolism. CT angiography imaging demonstrates transient interruption of the contrast bolus. (A) Axial image of the thorax at the level of the main pulmonary artery demonstrates suboptimal contrast enhancement of the main pulmonary artery, despite the region of interest being correctly positioned on the main pulmonary artery and bolus tracking initiated when the predetermined HU contrast threshold of 150 was reached. Note that the SVC remains well opacified, indicating that contrast is still being administered. Importantly, the aorta, which is a downstream vessel demonstrates greater opacification than the MPA. (B) Coronal image from the same study demonstrates a large volume of unopacified blood entering (black arrow) the right atrium from the IVC due to the patient taking a deep breath just prior to imaging, resulting in the mixing artifact and decreased opacification of the MPA, also known as transient interruption of the contrast bolus. (C) Repeat imaging was performed after breath instructions were given with the same imaging technique and diagnostic opacification in the MPA was obtained. Concentration of iodinated contrast was 350 mg iodine/mL.
Patients with heart failure
CM arrival in the target vessel is delayed in patients with heart failure.[16] This is particularly important when scanning the aorta, and carotid arteries or performing peripheral CTA runoff, often leading to suboptimal opacification and mixing artifacts from transient interruption of CM bolus, especially when using standard delayed acquisition time. As stated previously, using a test bolus to determine CM arrival time at two locations in the same vessel (i.e., ascending and descending aorta) or a second acquisition for the distal station can be performed to better determine the arrival time of the diagnostic CM in the target vessel of choice [Figure 5].[16,45]
Protocols for low volume CM CTA used at our institution
The different techniques used at our institution for the common indications are summarized in Table 2 and briefly described below. These protocols were developed using a concentration of 350 mg iodine/ mL for the CM. For all cases, a 70% iodinated CM and 30% saline or an 80% iodinated CM and 20% saline CM blend can also be used during the diagnostic phase of imaging to reduce overall CM volume. Protocols are summarized in Table 2.
| Common low contrast dose indications for imaging | ||||||||||||||
|---|---|---|---|---|---|---|---|---|---|---|---|---|---|---|
| Scanner Type | Contrast medium volume (mL) | Contrast arrival time technique | Pulmonary embolism (PE) | Acute aortic syndrome (AAS) | Double rule out for PE and AAS | Pulmonary vein mapping | Aortic imaging for TAVR | Aorta with peripheral runoff | ||||||
| ROI | Contrast Modification | ROI | Contrast Modification | ROI | Contrast Modification | ROI | Contrast Modification | ROI | Contrast Modification | ROI | Contrast Modification | |||
| 64-slice | 30-50 mL | Bolus tracking | IVC or RA | Triphasic Contrast 2 mL/s; Contrast 4 mL/s; Saline 4 mL /s |
LA | Triphasic 50% Contrast/saline blend 2 mL/s; Contrast 4 mL/s; Saline 4 mL /s |
LA | Triphasic 50% Contrast/saline blend 2 mL/s; Contrast 4 mL/s; Saline 4 mL /s |
MPA | Triphasic 50% Contrast/saline blend 2 mL/s; Contrast 4 mL/s; Saline 4 mL/s |
LA | Triphasic 50% Contrast/saline blend 2 mL/s; 80% Contrast/Saline blend 4 mL/s; Saline 4 mL/s |
Dsc Ao | Triphasic 50% Contrast/saline blend 2 mL/s; 80% Contrast/Saline blend 4 mL/s; Saline 4 mL/s |
| Test bolus 10 mL 50/50 contrast saline blend |
MPA | Contrast 4 mL/s; Saline 4 mL /s |
Asc Ao | Contrast 4 mL/s Saline 4 mL /s |
Asc Ao, MPA, Dcs Ao | Contrast 4 mL/s Saline 4 mL /s |
LA | Contrast 4 mL/s Saline 4 mL/s |
Asc Ao | 80% Contrast/Saline blend 4 mL/s; Saline 4 mL/s |
Dsc Ao | 80% Contrast/Saline blend 4 mL/s; Saline 4 mL/s |
||
| Faster scanner, dual source, 256 slice etc. | 15-40 mL | Test bolus 10 mL 50/50 contrast saline blend |
MPA | Contrast 4 mL/s; Saline 4 mL /s |
Asc Ao | 80% Contrast/Saline blend 4 mL/s; Saline 4 mL /s |
Asc Ao, MPA, Dsc Ao | Contrast 4 mL/s; Saline 4 mL /s |
LA | Contrast 4 mL/s Saline 4 mL/s |
Asc Ao | 80% Contrast/Saline blend 4 mL/s; Saline 4 mL/s |
Dsc Ao | 80% Contrast/Saline blend 4 mL/s; Saline 4 mL/s |
Pulmonary embolism (PE)
The evaluation of pulmonary embolism with reduced volume of CM can be performed by bolus-tracking technique with the ROI on the main pulmonary artery or an upstream target such as the superior vena cava or within the right atrium in patients with no known cardiac disease [Figure 6, supplemental digital content 2].[17] In our experience when imaging patients with suspected heart failure or when scanning patients using a faster scanner, the scan is better optimized by utilizing the test-bolus technique.[25] The CM arrival time can then be used to perform a high pitch acquisition as described above. Contrast saline blend with dual-energy image reconstruction at 50 keV is useful to decrease the CM volume.[46]
Acute aortic syndrome (AAS)
The evaluation for acute aortic syndrome using low CM volume can be performed by using a bolus-tracking technique from the ascending aorta.[25] In our experience when using a conventional 64-slice CT, a bolus tracker can be placed in the left ventricle [Figure 2]. This is similar to the approach used by Wu et al. in initiating a pulmonary artery CTA from superior vena cava.[17] In patients with known heart failure, aortic aneurysm, or when using faster scanners, the test-bolus technique can be used to identify the correct peak enhancement time in the ascending and descending thoracic aorta [Figures 5 and 8 , supplemental digital content 3].[10,16]
Double Rule out for PE and AAS
The evaluation for acute aortic syndrome and pulmonary embolus using low CM volume can be challenging. This is best performed by first calculating pulmonary transit time [Figures 2 and 4 , respectively, supplemental digital content 1].[16] The scan should be triggered from the CM arrival time in the ascending aorta. The CM bolus should be long enough to account for the pulmonary and aortic transit time to ensure enough CM is present in the pulmonary artery for pulmonary embolus detection.
Aortic imaging for preprocedure planning prior to aortic or mitral valve replacement
Aortic imaging for preprocedure valve planning can be performed by using the modified test-bolus technique with the calculation of aortic or left atrial transit time or modified bolus-tracking technique [Figure 10, supplemental digital content 4 and 5]. The test-bolus technique is especially useful in patients with known heart failure as transit time is often delayed. We prefer to perform these acquisitions on a faster scanner than a 64-slice CT. Two phases of diagnostic imaging are obtained, first, a CM-enhanced retrospective ECG-gated CTA performed over the heart, followed immediately by a second, a non-ECG-gated high-pitch axial acquisition performed during the same breath hold. The CM used can be reduced by limiting the ECG gated scan to the aortic root only.[47]

- 80-year-old female with aortic stenosis and mitral valve disorder presenting for pre-procedure planning for transcatheter aortic valve and mitral valve replacement. Using a modified test bolus technique, 10 mL of an 50% iodinated contrast* and 50% saline blend was injected at a rate of 3.5 mL/second followed by 20 mL of saline, for a total contrast volume of 5 mL of contrast and a time-enhancement curve was obtained by measuring the enhancement within the aorta (not shown). The diagnostic portion of the study was performed with 37 mL of an 80% iodinated contrast and 20% saline blend was injected at a rate of 3.5 mL/second followed by 30 mL of saline. A total of 30 mL of iodinated contrast was utilized in the diagnostic portion of the study. Two phases of diagnostic imaging were obtained, first a contrast-enhanced retrospective ECG-gated CTA performed over the heart followed by a non-ECG-gated high-pitch axial acquisition performed during the same breath hold. (A) Double oblique CT image at the level of the heart was diagnostic for measurement acquisition. Straight line (B) image demonstrate diagnostic opacification of the aorta, from the branch arch vessels through the upper extremities. Concentration of iodinated contrast was 350 mg iodine/mL.
Aortic imaging with runoff to the lower extremity peripheral arteries
The evaluation of the peripheral extremity arteries can be performed by using the modified bolus-tracking technique with the ROI on the left ventricle for an upper extremity evaluation or ROI on the upper abdominal aorta for lower extremity examination. We prefer to perform such acquisitions on a faster scanner than a 64-slice CT. In addition, we modify the CM injection and the CT parameters. A dual-energy scan can [Figure 11, supplemental digital content 6] be used to boost the CM to noise ratio, as well as perform calcium-free reconstructions.[48] When using a faster scanner in a patient with heart failure or suspected peripheral vascular disease, two separate test-bolus analyses at the level of the aorta and popliteal artery are used to assess the aortopopletial transit time.[49] In case of significant delay between the upper and distal stations, two separate acquisitions can be obtained.

- 73 year-old-female with a history of abdominal aortic aneurysm and peripheral arterial disease presenting for aortic imaging with runoff to the lower extremities as part of pre-procedure planning. Using a modified bolus tracking technique, 10 mL of an 50% iodinated contrast* and 50% saline blend was injected at a rate of 2.0 mL/second followed by 36 mL of an 80% iodinated contrast and 20% saline blend injected at a rate of 4.0 mL/second followed by 50 mL of saline at the same rate. A total of 34 mL of iodinated contrast was utilized in the study. A bolus tracking method was utilized, with the ROI located in the descending thoracic aorta and the study was initiated in the upslope of contrast enhancement. Note that the HU threshold to trigger the initiation of the study was lowered to 120 HU. Dual energy non-ECG-gated high-pitch axial images were obtained from the lung base through the toes. Axial MPR images of the abdomen (A) and axial MPR (B) image of the caves demonstrate diagnostic images of the vasculature at both levels. *Concentration of iodinated contrast was 350 mg iodine/mL.
Pulmonary vein CT venography
Pulmonary vein mapping can be performed with the modified bolus-tracking technique with ROI at the left atrium and left ventricle to determine CM bolus arrival in the structures of interest [Figure 12, supplemental digital content 7]. When scanning patients with heart failure or when a scan is being performed using a faster scanner, the test-bolus technique is used for Acute Aortic Syndrome imaging. Delayed phase imaging, to assess for thrombus versus slow flow within the atrial appendage, can be limited with a low iodinated CM volume technique.

- 74-year-old-female with a history of atrial fibrillation presenting for pulmonary vein mapping prior to ablation. Using a modified test bolus technique, 10 mL of an 50% iodinated contrast* and 50% saline blend was injected at a rate of 4 mL/second followed by 20 mL of saline, for a total contrast volume of 5 mL of contrast. (A) Subsequently multiple low-radiation-dose sequential images were acquired at a fixed scan level over the right atria (1), descending aorta (2), left atria (3), and left ventricle (4) and a time-enhancement curve was obtained by measuring the enhancement within the target vessels of interest (not shown). Peak enhancement within the descending aorta was identified at 19.1 sec, the left atria at 1.3 sec, and the left ventricle at 20.2 sec. The diagnostic portion of the study was performed with 25 mL of an 80% iodinated contrast and 20% saline blend was injected at a rate of 4 mL/second followed by 50 mL of saline a 20 second delay based on these times. A total of 20 mL of iodinated contrast was utilized in the diagnostic portion of the study. A contrast-enhanced retrospective ECG-gated CTA performed over the heart. Axial (B) image demonstrates diagnostic opacification of the pulmonary veins. *Concentration of iodinated contrast was 350 mg iodine/mL.
CONCLUSION
Low CM volume CTA is feasible in patients with decreased renal function for nearly every CTA indication. As discussed by changing parameters related to injection, scan delay times, image acquisition, and being aware of patient-specific modifications, a diagnostic scan can result in low CM volume injections.
Declaration of patient consent
Patient’s consent not required as patients identity is not disclosed or compromised.
Financial support and sponsorship
Nil.
Conflict of interest
Authors Susan Hobbs and Abhishek Chaturvedi are on the Editorial Board of the journal.
Supplemental digital content 1. A 51-year-old female presenting to the emergency department with chest pain and shortness of breath. Double rule out CTA study for aortic dissection and pulmonary embolus employing both a reduced contrast media flow rate and an iodinated contrast blend to reduce overall contrast volume. See figure legend 2 for description of the procedure and imaging findings.
Supplemental digital content 2. A 74-year-old female presenting to the emergency department with hypoxia and syncope and a clinical concern for pulmonary embolism. Pulmonary Angiography using a bolus tracking technique. See figure legend 6 for description of the procedure and imaging findings.
Supplemental digital content 3. A 84-year-old female presenting to the emergency department after an unwitnessed fall and acute blood loss anemia with a concern for acute aortic injury. Modification of the bolus tracking method using a triphasic contrast injection and decreasing the enhancement threshold. See figure legend 8 for description of the procedure and imaging findings.
Supplemental digital content 4. A 80-year-old female with aortic stenosis and mitral valve disorder presenting for pre-procedure planning for transcatheter aortic valve and mitral valve replacement. Cardiac gated portion of cardiac imaging shown. See figure legend 10 for description of the procedure and imaging findings.
Supplemental digital content 5. A 80-year-old female with aortic stenosis and mitral valve disorder presenting for pre-procedure planning for transcatheter aortic valve and mitral valve replacement. Non-gated portion of chest, abdomen and pelvis imaging shown. See figure legend 10 for description of the procedure and imaging findings.
Supplemental digital content 6. A 73-year-old-female with a history of abdominal aortic aneurysm and peripheral arterial disease presenting for aortic imaging with runoff to the lower extremities as part of pre-procedure planning. See figure legend 11 for description of the procedure and imaging findings.
Supplemental digital content 7. A 74-year-old-female with a history of atrial fibrillation presenting for pulmonary vein mapping prior to ablation. See figure legend 12 for description of the procedure and imaging findings.
References
- Global prevalence of chronic kidney disease - A systematic review and meta-analysis. PLoS One. 2016;11:e0158765.
- [CrossRef] [PubMed] [Google Scholar]
- Updates in vascular computed tomography. Radiol Clin North Am. 2020;58:671-91.
- [CrossRef] [PubMed] [Google Scholar]
- Use of intravenous iodinated contrast media in patients with kidney disease: Consensus statements from the American College of Radiology and the National Kidney Foundation. Radiology 2020:192094.
- [CrossRef] [PubMed] [PubMed Central] [Google Scholar]
- Controversies in contrast material-induced acute kidney injury: Propensity score matching of patients with different dose/absolute glomerular filtration rate ratios. Radiology. 2015;277:633-7.
- [CrossRef] [PubMed] [Google Scholar]
- Intravenous CT contrast media and acute kidney injury: A multicenter emergency department-based study. Radiology 2021:204446.
- [CrossRef] [PubMed] [Google Scholar]
- Yang, Radiation and contrast agent doses reductions by using 80-kV tube voltage in coronary computed tomographic angiography: A comparative study. Eur J Radiol. 2014;83:309-14.
- [CrossRef] [PubMed] [Google Scholar]
- 80-kV pulmonary CT angiography with 40 mL of iodinated contrast material in lean patients: Comparison of vascular enhancement with iodixanol (320 mg I/mL) and iomeprol (400 mg I/mL) AJR Am J Roentgenol. 2012;199:1220-5.
- [CrossRef] [PubMed] [Google Scholar]
- /6/2022 [cited 2022 52022 05/13/2022]; Available from:
- Scan time adapted contrast agent injection protocols with low volume for low-tube voltage CT angiography: An in vitro study. Eur J Radiol. 2017;93:65-9.
- [CrossRef] [PubMed] [Google Scholar]
- Ultra-low contrast computed tomographic angiography (CTA) with 20-mL total dose for transcatheter aortic valve implantation (TAVI) planning. J Comput Assist Tomogr. 2014;38:105-9.
- [CrossRef] [PubMed] [Google Scholar]
- Minimizing contrast media dose in CT pulmonary angiography with high-pitch technique. Br J Radiol. 2020;93
- [CrossRef] [PubMed] [Google Scholar]
- The frequency of insufficient contrast enhancement of the pulmonary artery in routine contrast-enhanced chest CT and its improvement with an increased injection rate: A prospective study. J Thorac Imaging. 2011;26:42-7.
- [CrossRef] [PubMed] [Google Scholar]
- Intravenous contrast medium administration and scan timing at CT: Considerations and approaches. Radiology. 2010;256:32-61.
- [CrossRef] [PubMed] [Google Scholar]
- Peak contrast enhancement in CT and MR angiography: When does it occur and why? Pharmacokinetic study in a porcine model. Radiology. 2003;227:809-16.
- [CrossRef] [PubMed] [Google Scholar]
- High-concentration contrast media in MDCT angiography: Principles and rationale. Eur Radiol. 2003;13 Suppl 3:N39-43.
- [CrossRef] [PubMed] [Google Scholar]
- Identification of patients with heart failure from test bolus of computed tomography angiography in patients undergoing preoperative evaluation for transcatheter aortic valve replacement. J Thorac Imaging. 2020;35:309-16.
- [CrossRef] [PubMed] [Google Scholar]
- Pulmonary 64-MDCT angiography with 30 mL of IV contrast material: Vascular enhancement and image quality. AJR Am J Roentgenol. 2012;199:1247-51.
- [CrossRef] [PubMed] [Google Scholar]
- Common terminology for single and multislice helical CT. AJR Am J Roentgenol. 2001;176:1135-6.
- [CrossRef] [PubMed] [Google Scholar]
- Principles of CT and CT technology. J Nucl Med Technol. 2007;35:115-28. quiz 129-30
- [CrossRef] [PubMed] [Google Scholar]
- MDCT Physics: The Basics: Technology, Image Quality and Radiation Dose. Lippincott Williams & Wilkins;
- Using the K-edge to improve contrast conspicuity and to lower radiation dose with a 16-MDCT: A phantom and human study. J Comput Assist Tomogr. 2006;30:391-7.
- [CrossRef] [PubMed] [Google Scholar]
- Image quality and radiation dose of lower extremity CT angiography using 70 kVp, high pitch acquisition and sinogram-affirmed iterative reconstruction. PLoS One. 2014;9:e99112.
- [CrossRef] [PubMed] [Google Scholar]
- Non-electrocardiogram-triggered 70-kvp high-pitch computed tomography angiography of the whole aorta with iterative reconstruction: Initial results. J Comput Assist Tomogr. 2016;40:109-17.
- [CrossRef] [PubMed] [Google Scholar]
- Reducing contrast medium volume and tube voltage in CT angiography of the pulmonary artery. Clin Radiol. 2016;71:615.e7-615.e13.
- [CrossRef] [PubMed] [Google Scholar]
- Reducing iodine contrast volume in CT angiography of the abdominal aorta using integrated tube potential selection and weight-based method without compromising image quality. AJR Am J Roentgenol. 2017;208:552-63.
- [CrossRef] [PubMed] [Google Scholar]
- CT coronary angiography: 256-slice and 320-detector row scanners. Curr Cardiol Rep. 2010;12:68-75.
- [CrossRef] [PubMed] [Google Scholar]
- Prospective ECG-gated 320-row CT angiography of the whole aorta and coronary arteries. Eur Radiol. 2012;22:2432-40.
- [CrossRef] [PubMed] [Google Scholar]
- Clinical applications of wide-detector ct scanners for cardiothoracic imaging: An update. Korean J Radiol. 2019;20:1583-96.
- [CrossRef] [PubMed] [Google Scholar]
- High-pitch thoracic CT with simultaneous assessment of coronary arteries: Effect of heart rate and heart rate variability on image quality and diagnostic accuracy. JACC Cardiovasc Imaging. 2011;4:602-9.
- [CrossRef] [PubMed] [Google Scholar]
- High-pitch dual-source CT angiography without ECG-gating for imaging the whole aorta: Intraindividual comparison with standard pitch single-source technique without ECG gating. Diagn Interv Radiol. 2017;23:293-9.
- [CrossRef] [PubMed] [Google Scholar]
- Ultra-low dose contrast CT pulmonary angiography in oncology patients using a high-pitch helical dual-source technology. Diagn Interv Radiol. 2019;25:195-203.
- [CrossRef] [PubMed] [Google Scholar]
- Feasibility of ow-dose contrast medium high pitch CT angiography for the combined evaluation of coronary, head and neck arteries. PLoS One. 2014;9:e90268.
- [CrossRef] [PubMed] [Google Scholar]
- Substantial iodine volume load reduction in CT angiography with dual-energy imaging: Insights from a pilot randomized study. Int J Cardiovasc Imaging. 2014;30:1613-20.
- [CrossRef] [PubMed] [Google Scholar]
- Virtual monochromatic dual-energy aortoiliac CT angiography with reduced iodine dose: A prospective randomized study. AJR Am J Roentgenol. 2019;212:467-74.
- [CrossRef] [PubMed] [Google Scholar]
- Comprehensive comparison of virtual monoenergetic and linearly blended reconstruction techniques in third-generation dual-source dual-energy computed tomography angiography of the thorax and abdomen. Invest Radiol. 2016;51:582-90.
- [CrossRef] [PubMed] [Google Scholar]
- Assessment of an advanced image-based technique to calculate virtual monoenergetic computed tomographic images from a dual-energy examination to improve contrast-to-noise ratio in examinations using iodinated contrast media. Invest Radiol. 2014;49:586-92.
- [CrossRef] [PubMed] [Google Scholar]
- Value of a noise-optimized virtual monoenergetic reconstruction technique in dual-energy CT for planning of transcatheter aortic valve replacement. Eur Radiol. 2017;27:705-14.
- [CrossRef] [PubMed] [Google Scholar]
- Low dose and low contrast medium coronary ct angiography using dual-layer spectral detector CT. Int Heart J. 2019;60:608-17.
- [CrossRef] [PubMed] [Google Scholar]
- Prospective comparison of dual-energy CT aortography using 70% reduced iodine dose versus single-energy CT aortography using standard iodine dose in the same patient. Abdom Radiol (NY). 2017;42:759-65.
- [CrossRef] [PubMed] [Google Scholar]
- Review of clinical applications for virtual monoenergetic dual-energy CT. Radiology. 2019;293:260-71.
- [CrossRef] [PubMed] [Google Scholar]
- Update on multienergy CT: Physics, principles, and applications. Radiographics. 2020;40:1284-308.
- [CrossRef] [PubMed] [Google Scholar]
- Initial experience of the application of third-generation dual-source CT scanner in high-pitch angiography of aorta. Zhongguo Yi Xue Ke Xue Yuan Xue Bao. 2017;39:68-73.
- [CrossRef] [PubMed] [Google Scholar]
- Noise reduction in spectral CT: Reducing dose and breaking the trade-off between image noise and energy bin selection. Med Phys. 2011;38:4946-57.
- [CrossRef] [PubMed] [Google Scholar]
- Contrast opacification on thoracic CT angiography: Challenges and solutions. Insights Imaging. 2017;8:127-40.
- [CrossRef] [PubMed] [Google Scholar]
- Current contrast media delivery strategies for cardiac and pulmonary multidetector-row computed tomography angiography. J Thorac Imaging. 2010;25:270-7.
- [CrossRef] [PubMed] [Google Scholar]
- Reduced iodine load at CT pulmonary angiography with dual-energy monochromatic imaging: Comparison with standard CT pulmonary angiography-A prospective randomized trial. Radiology. 2012;262:290-7.
- [CrossRef] [PubMed] [Google Scholar]
- Very low intravenous contrast volume protocol for computed tomography angiography providing comprehensive cardiac and vascular assessment prior to transcatheter aortic valve replacement in patients with chronic kidney disease. J Cardiovasc Comput Tomogr. 2016;10:316-21.
- [CrossRef] [PubMed] [Google Scholar]
- Material separation using dual-energy CT: Current and emerging applications. Radiographics. 2016;36:1087-105.
- [CrossRef] [PubMed] [Google Scholar]
- Low contrast volume run-off CT angiography with optimized scan time based on double-level test bolus technique-feasibility study. Eur J Radiol. 2014;83:e147-55.
- [CrossRef] [PubMed] [Google Scholar]