Translate this page into:
Efficacy of Computed Tomography Pulmonary Angiography as Non-invasive Imaging Biomarker for Risk Stratification of Acute Pulmonary Embolism

*Corresponding author: Mahmoud M. Higazi, Department of Radiology, Minia University, Minia 61519, Egypt. mahmoud.higazi@minia.edu.eg
-
Received: ,
Accepted: ,
How to cite this article: Higazi MM, Abdel Fattah RA, Abdelghany EA, Abdel Ghany HS. Efficacy of computed tomography pulmonary angiography as non-invasive imaging biomarker for risk stratification of acute pulmonary embolism. J Clin Imaging Sci 2020;10:49.
Abstract
Objectives:
Massive and sub-massive pulmonary embolisms (PEs) are associated with high mortality and morbidity. The mainstay of treatment for PE is anticoagulation. However, high- and intermediate-risk patients may benefit from interventional thrombolytic therapy. Computed tomography pulmonary angiography (CTPA) is widely available, fast, and non-invasive technique, and it can identify pulmonary thrombus down to at least a segmental level. In this study, we attempt to evaluate the efficacy of CTPA as a non-invasive imaging biomarker for risk stratification of acute PE (APE) patients.
Material and Methods:
This is a prospective study conducted on 150 patients who proved to have APE by CTPA. The simplified PE severity index score was obtained. The pulmonary artery obstruction index (PAOI) using and right to left ventricular (RV/LV) diameter ratios were calculated.
Results:
The patients were divided into (1) high risk (shocked) and (2) non-high risk groups. There was a significant difference between the 1st and 2nd groups regarding PAOI. Hemodynamically stable patients were further subclassified according to the right ventricular dysfunction (RVD) into Group Ia (intermediate risk) and Group Ib (low risk). There was a significant difference between subgroups regarding PAOI (P < 0.0001, r = 0.385). Receiver operating characteristic curve analysis revealed PAOI >47% associated with RV/LV ratio >1.
Conclusion:
Our results support the use of CTPA as a surrogate imaging biomarker for both diagnosis and risk stratification of APE patients. CTPA allows assessment of clot burden through PAOI calculation and identification of intermediate-risk PE through the assessment of RVD.
Keywords
Computed tomography
Pulmonary angiography
Obstruction index
Biomarker
Non-invasive

INTRODUCTION
Massive and submassive pulmonary embolism (PE) is associated with high mortality and morbidity. Rapid diagnosis and treatment are, therefore, essential to save patients’ lives. Risk stratification scores are used to determine the risk of complications and associated mortality. High-risk and intermediate-risk PE can be divided by a hemodynamic presentation.[1]
Massive PE occurs in about 5% of patients with PE and carries a mortality rate of 18–65%. It is presented with sustained hypotension (systolic blood pressure [BP] <90 for at least 15 min), with signs or symptoms of shock.[2] Submassive PE is seen in about 40% of patients with PE and carries a 5–25% mortality rate. Patients with submassive PE are systemically normotensive with evidence of myocardial ischemia and/or right ventricular dysfunction (RVD).[2] The remaining 55% of patients with PE present with non-massive or low-risk PE, also called uncomplicated PE, with a mortality rate of only 1%. They are systemically normotensive, without RVD or myocardial ischemia.[3]
The mainstay of treatment for all patients presenting with PE is anticoagulation.[4] However, as the spectrum of PE severity varies widely, high-risk patients may require additional treatment measures to reduce the clot burden. Systemic intravenous thrombolysis or catheter-directed thrombolysis has been shown to improve mortality and hemodynamic stability when used for patients with high risk (massive) and high-intermediate risk (submassive) PE.[5,6] Meanwhile, systemic thrombolysis is associated with a high risk of hemorrhage. Hence, emergency physicians must be able to risk stratify patients to ensure rapid access to advanced therapy for the appropriate candidate patients.[7,8]
Diagnostic strategies for evaluating PE have undergone important changes over the past decades.[9] Computed tomography pulmonary angiography (CTPA) has become the imaging method of choice in the diagnosis of acute PE (APE), being widely available, fast, and non-invasive technique, it can directly visualize emboli and may provide alternative diagnoses.[10] CTPA may replace echocardiography, as it can identify pulmonary thrombus down to at least segmental level, to quantify the degree of PE, and at the same time, it allows evaluation of RV enlargement as an indicator of RVD.[11] In this study, we attempt to evaluate the efficacy of CTPA as a non-invasive imaging biomarker for risk stratification of APE patients.
MATERIAL AND METHODS
This is a prospective study conducted on 150 patients who had been proven diagnosis of PE by CTPA. They were recruited from the emergency department, respiratory/ coronary, or general ICU presented by signs or symptoms of suspected APE. The ethics committee approval was obtained and all enrolled patients completed a written consent form.
Clinical risk stratification
The simplified pulmonary embolism severity index (sPESI) score was calculated for all patients. The sPESI is a risk stratification clinical tool that has been validated to determine the mortality and outcome of patients with newly diagnosed PE. The patients were grouped according to PESI score into a low-risk group (0 points) and high-risk group (<0 points). The low-risk group patients should have age (<80 years), no history of cancer, no history of chronic cardiopulmonary disease, HR <110 bpm, systolic BP ≥100 mmHg, and O2 saturation ≥90.
Laboratory investigations
D-Dimer assay
The D-dimer cutoff value >500 ng/ml was considered positive and results <500 ng/ml were considered negative.
Arterial blood gases
Arterial blood gases including arterial partial pressure of oxygen (PaO2), the partial pressure of carbon dioxide (PaCO2), and arterial oxygen saturation (SaO2) were measured on admission to the emergency department while the patient breathing room air. The alveolar-arterial gradient was also calculated.
Imaging
CTPA
Non-ECG-gated multidetector CT (MDCT) pulmonary angiography was performed for all patients of the study. CT scans were obtained with a 16-slice MDCT scanner (LightSpeed General Electric Medical Systems, Milwaukee, WI, USA). MDCT pulmonary angiography was carried out at 120 kV, 100 mAs, with 0.75 mm collimation and pitch of 1.22. Images were reconstructed with a slice thickness of 1 mm, a reconstruction interval of 0.7 mm. The area from the supra-aortic trunks to the base of the lungs was studied from cranial to caudal direction.
The patients were placed in a supine position and 100–120 mL of non-ionic iodinated contrast medium (Isovue 370, Bracco Diagnostics, Princeton, NJ) was injected through an ante- cubital vein at a rate of 3–4 mL/s. A 20 mL of normal saline was injected at the same rate before and after contrast administration to check the IV line for saline extravasation and as a washout bolus, respectively. The scanning delay time was determined using the bolus-tracking technique in the lumen of the pulmonary trunk. The threshold value was selected at 120 HU. The total scanning time was approximately 4–5 s. The CT scanning was performed with a bolus-tracking technique after the start of contrast medium injection, from the lowest hemidiaphragm to the top of the lungs.
Image interpretation
Images were reviewed at a workstation, reconstructed using a mediastinum/soft-tissue algorithm to reduce the edge- enhancing artifacts that may mimic emboli when bone algorithms are utilized. Multiplanar reconstruction images were generated along the long axis of vessels. The pulmonary artery obstruction index (PAOI) using Qanadli et al. score[12] and right to left ventricular (RV/LV) diameter ratios were calculated for all patients without the knowledge of their clinical assessment or diagnostic examination results.
CTPA diagnostic criteria for APE included: (1) Complete arterial occlusion with failure to opacify the entire lumen and the artery may be enlarged in comparison with the pulmonary arteries of the same order of branching. (2) Central arterial filling defect surrounded by IV contrast material. (3) Peripheral intraluminal filling defect that makes an acute angle with an arterial wall.
PAOI measurement
The index was defined as the product of N × D. Where N was the value of the clot site and D was the degree of obstruction, defined as 1 for partial obstruction and 2 for total obstruction. To define the N, the arterial tree of each lung was regarded as having 10 segmental arteries (three to the upper lobes, two to the middle lobe and the lingula, and five to the lower lobes). The presence of embolus in a segmental artery was scored 1 point. Emboli in the most proximal arterial level were scored a value equal to the number of segmental arteries arising distally.
The value of the most proximal thrombus in the pulmonary arterial tree scored a maximum of 6 (3 × 2) for the upper lobe arteries, 4 (2 × 2) for the middle lobe and the lingual arteries, 10 (5 × 2) for the lower lobe arteries, 14 (7 × 2) for the intermediate arteries, and 20 (10 × 2) for the main pulmonary artery. Thus, the maximal PAOI was 40. The final PAOI for each patient was expressed as percent (score/40 × 100).
RV diameter (RVD)/LV diameter (LVD) ratio
The axial sections that showed the maximal distance between the ventricular endocardium and the interventricular septum, perpendicular to the long axis of the heart, were used for RVD and LVD measurements. RVD axial and LVD axial were subsequently measured and RVD/LVD ratio was calculated.
Transthoracic echocardiography
Trans-thoracic echocardiograms were done to detect signs of pulmonary hypertension as flattening of the interventricular septum during systole, tricuspid regurgitation flow velocity higher than 2.7 m/s with measurement of systolic pulmonary arterial pressure (sPAP) as well as right/left ventricular end- diastolic diameter ratio.
Statistical analysis
Data were collected, revised, verified, coded, Statistical Package for the Social Sciences version 20 was used for statistical analysis. Descriptive statistics for quantitative data: Mean and standard deviation were calculated. Kolmogorov–Smirnov for normality test was used to differentiate between parametric data and non-parametric data. Independent sample t-test used for the analysis of quantitative data. Chi-square test, Fisher’s exact test were used for analysis of qualitative data. For all, P was considered significant if <0.05, highly significant if <0.01, and very highly significant if <0.001.
RESULTS
The current study included 150 patients with CTPA proved APE. The final diagnosis regarding the presence or absence of PE was based on the result of MDCTPA. They were 98 (65%) females and 57 (35%) males. The average age of the patients was 58 ± 17 years. All the patients were above 18 years old. Regarding risk factors and comorbidities, we found that 42 patients (28%) were diabetic, 24 patients (16%) had chronic obstructive pulmonary disease, 12 patients (8%) were postpartum, 15 patients (10%) had a history of deep vein thrombosis, and 15 patients (10%) had a surgical history, 6 patients (4%) had a history of malignancy, 33 patients (22%) had more than one comorbidity, while no comorbidity found in 24 patients (16%). Concerning the distribution of the patients according to their sPESI score, 42/150 (28%) were low risk, while 108/150 (72%) were high-risk patients.
Regarding the distribution of patients according to the site of the clot, most patients had a central level of involvement with PE which was found mainly central within the main pulmonary arteries in 69 patients (46%) and at the segmental pulmonary arterial level in 60 (40%), while 21 patients (14%) had PE isolated to the subsegmental level.
The patients were divided into (1) high risk and (2) non- high-risk groups according to systolic BP. Table 1 shows a summary of descriptive statistics for studied groups:
| High-risk PE, | Non-high risk PE | Pvalue* | |
|---|---|---|---|
| Group I n=97 | Group II n=53 | ||
| Demographic findings | |||
| Age, years | 57±12 | 48±18 | 0.626 |
| Sex, F | 65 (67%) | 33 (62%) | |
| Hospital length of stay (in days) | 14±3 | 9±2 | <0.0001 |
| Mortality rate | 20 (13%) | 0 | |
| Systolic arterial pressure, mmHg | 80±5 | 120±15 | <0.0001 |
| Laboratory findings | |||
| PaO2, mmHg | 61±13 | 65±15 | 0.354 |
| SaO2, % | 87±13 | 90±10 | 0.324 |
| A-aO2 | 49±14 | 43±19 | 0.259 |
| PaCO2 | 30±12 | 33±6 | 0.409 |
| Platelet, ×103μL | 226,400±85592 | 264,771±87779 | 0.161 |
| MPV, fL | 8.9±1 | 8±0.9 | 0.017 |
| PDW, fL | 15.9±1.1 | 15.2±0.8 | 0.046 |
| Echocardiography findings | |||
| sPAP, mmHg | 63±12 | 48±15 | 0.0006 |
| CTPA | |||
| PAOI | 66%±13% | 36%±13% | <0.0001 |
| RV/LV | 1.3±0.1 | 1.0±0.2 | 0.001 |
PaO2: Arterial partial pressure of oxygen, SaO2: Arterial oxygen saturation, MPV: Mean platelet volume, PDW: Platelet distribution width, HR: Heart rate, BP: Blood pressure, sPAP: Systolic pulmonary arterial pressure, RV/LV: The right ventricle to left ventricular diameter ratio, PAOI: Pulmonary artery obstruction index. * means significant difference
The 1st group included non-high-risk patients who had normal BP. They were 53/150 patients (35%), with mean age 48 ± 18 years, and mean systolic BP of 120 ± 15 mmHg. Mean PAOI for the 2nd group was 36% ± 13, ranging between 12.5% and 60%.
The 2nd group included high-risk patients who presented by shock or hypotension. They were 97/150 patients (65%), with mean age 57 ± 12 years, and mean systolic BP of 80 ± 5 mmHg. Mean PAOI for the 1st group was 66% ± 13%, ranging between 48% and 80%.
There was a significant difference between the 1st and 2nd groups regarding PAOI (P < 0.0001) [Figure 1]. Furthermore, significant differences regarding HR, length of hospital stay, RV/LV ratio, sPAP, MPV (P ≤ 0.0001, 0.0003, 0.0006, 0.007, and 0.046, respectively) were detected.
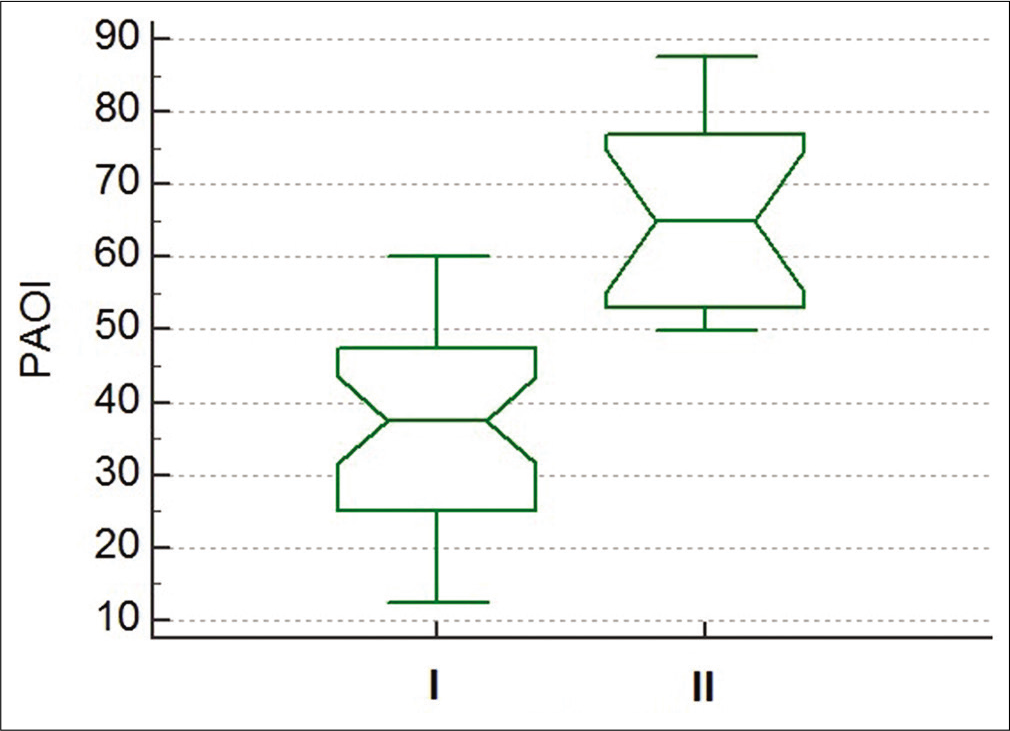
- Box plot showing the difference between pulmonary artery obstruction index for Group I (non-high risk) and Group II (high risk) (P < 0.0001).
There was a significant correlation found between PAOI and sPESI scoring (P = 0.0001 and r = 0.467). Furthermore, regression analysis revealed significant negative relation between systolic BP and PAOI (P = 0.0002 and r = −0.347), as shown in Figure 2.
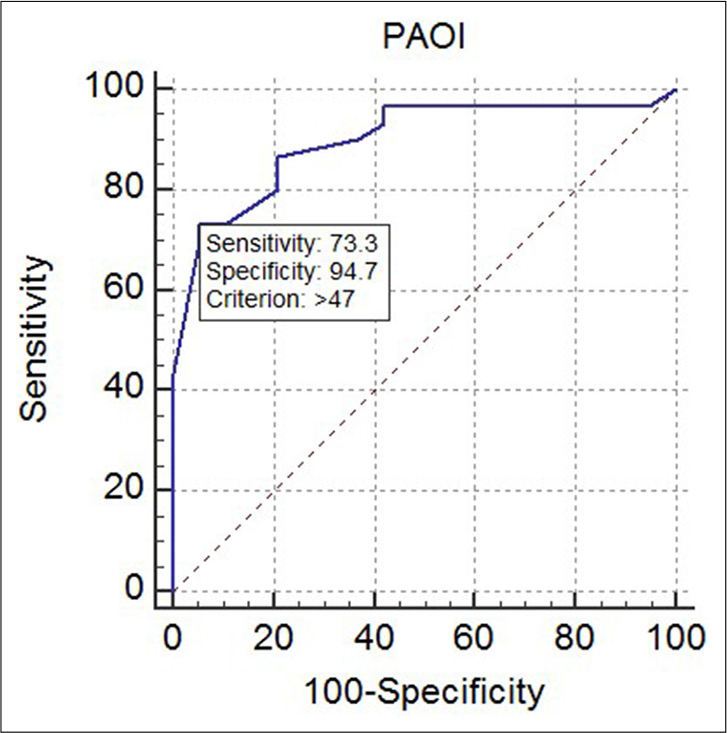
- Receiver operating characteristic curve for diagnostic performance of pulmonary artery obstruction index for predicting abnormally increased right to left ventricular ratio >1, thus indicating right ventricular dysfunction (P = 0.0015, area under the curve = 0.739).
The 1st group patients who were hemodynamically stable were further subclassified according to RV/LV ratio measured on CT angiography into two groups: Group Ia with RVD (intermediate-risk patients) and Group Ib with no RVD (low-risk patients) [Table 2]. The RVD group included 28/53 patients (53%), 17 (61%) females, 11 (39%) males, with a mean age of 50±18 and mean RVD and LVD 4.9 ± 0.5 cm and 4.1 ± 0.4 cm, respectively. The non-RVD group included 25/53 patients (47%), they were 19 (76%) females, 6 (24%) males, with a mean age of 49 ± 17 and mean RVD and LVD 4.0 ± 0.8 cm and 4.5 ± 0.7 cm, respectively. The mean RVD/LVD ratio for Group Ia and Group Ib was 1.2 ± 0.1 and 0.8 ± 0.1, respectively.
| RVD | No RVD | Pvalue* | |
|---|---|---|---|
| (n=28/53) | (n=25/53) | ||
| RV/LV ratio | 1.2±0.1 | 0.9±0.1 | <0.0001* |
| PAOI | 49%±18% | 33±13 | <0.0001* |
| Systolic BP | 130±25 | 120±20 | 0.193 |
| sPAP | 62.967±14 | 43.425±13 | <0.0001* |
| MPV | 9.037±0.2 | 8.083±0.2 | 0.0005* |
| PDW | 16.073±0.2 | 16.342±0.2 | 0.319 |
MPV: Mean platelet volume, PDW: Platelet distribution width, BP: Blood pressure, sPAP: Systolic pulmonary arterial pressure. * means significant difference
There was a highly significant difference between the two subgroups regarding PAOI (P < 0.0001, r = 0.385). The mean PAOI for Group Ia and Group Ib was 49% ±18% and 33% ± 13%, respectively.
Receiver operating characteristic (ROC) curve was constructed to establish the best cutoff value for PAOI which was associated with RV/LV ratio >1 and showed that PAOI >47% had the best sensitivity and specificity for predicting abnormally increased RV/LV ratio (P = 0.0015, area under the curve = 0.739, 95% confidence interval, 0.593–0.854).
Illustrative cases of studied patients having different degrees of severity of APE are shown in Figures 3-5.
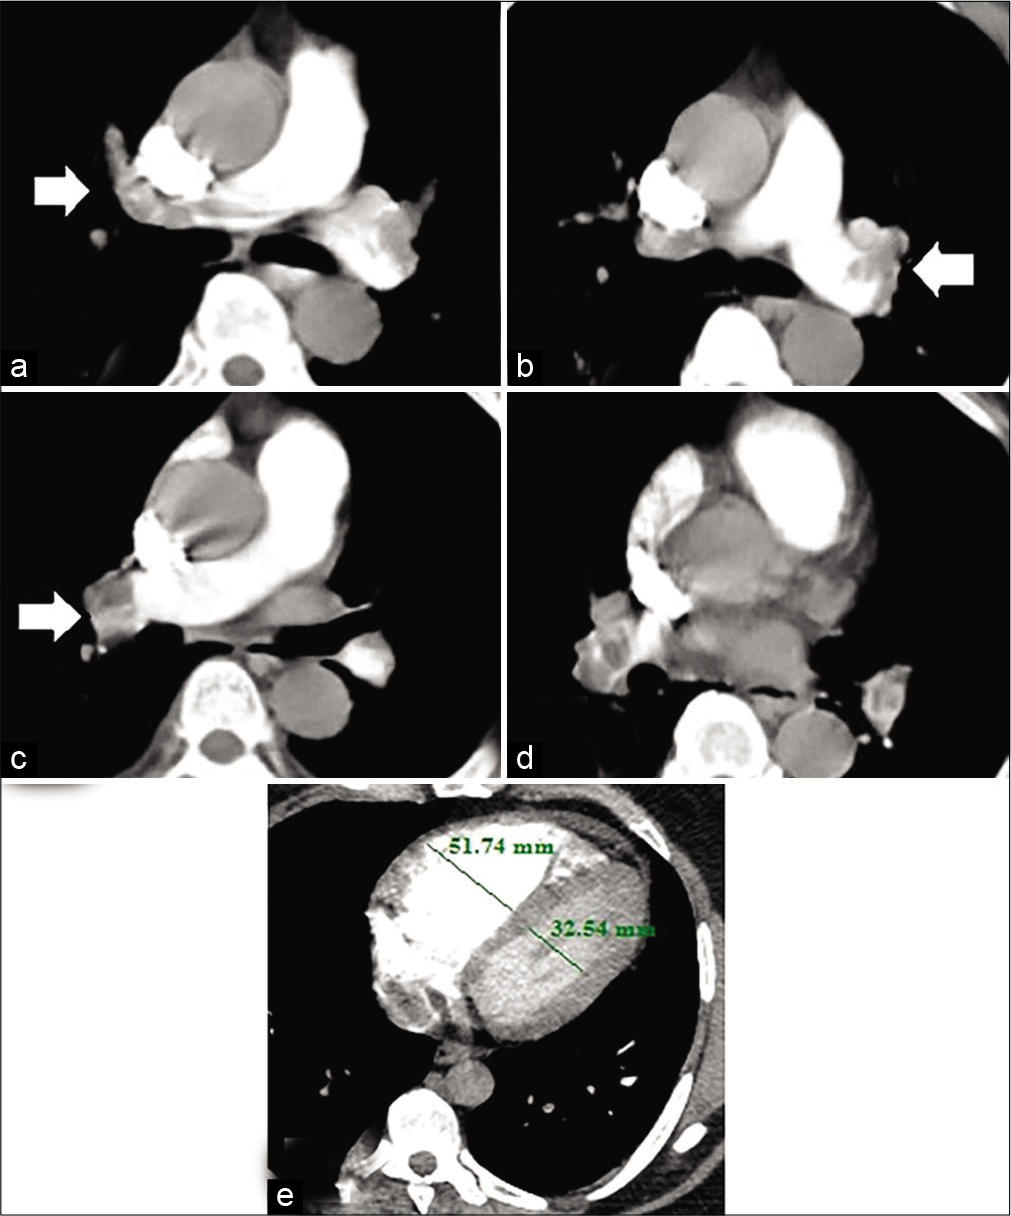
- A 63-year-old male patient presented by central chest pain and fainting. Recent history of lower limb deep vein thrombosis. Blood pressure 80/60 mmHg and heart rate: 130 bpm. High risk according to simplified pulmonary embolism severity index score. (a) Hypodense filling defect of pulmonary embolus seen totally occluding right main pulmonary artery trunk (arrow). (b) The thrombus is seen also totally obstructing the left main pulmonary artery trunk. (c and d) The thrombus is seen extending to main right (arrow) and left segment branches on both sides. (e) Right to left ventricular ratio >1, indicating right ventricular dysfunction. The calculated pulmonary artery obstruction index for this patient was 87.5% (high-risk group).
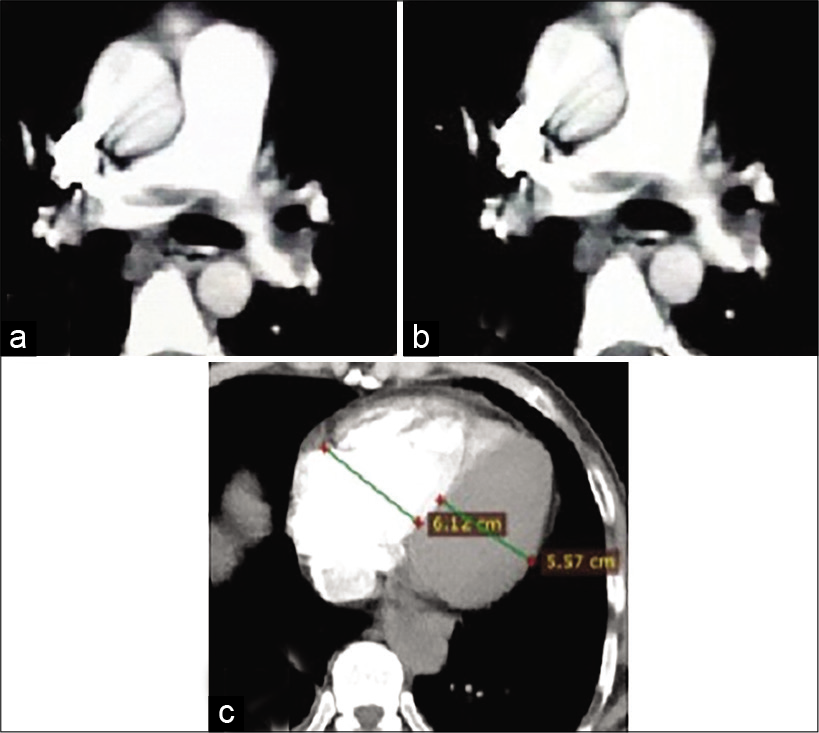
- A 45-year-old female patient presented by central chest pain and dyspnea. Recent history of immobilization. Blood pressure 110/60 mmHg and heart rate: 110 bpm. Low risk according to simplified pulmonary embolism severity index score. Non-totally occlusive saddle-shaped hypodense filling defect of pulmonary embolus is seen within the main pulmonary artery trunk. The thrombus is seen extending to the right (a) and left (b) pulmonary artery branches (c) Right to left ventricular ratio >1, indicating right ventricular dysfunction. The calculated pulmonary artery obstruction index for this patient was 50% (intermediate-risk group).
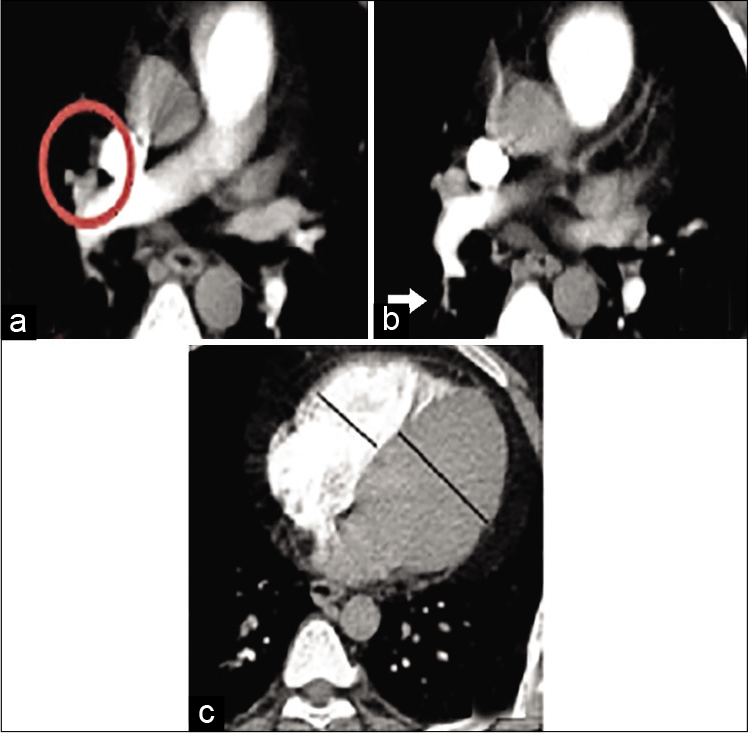
- A 27-year-old male patient presented by dyspnea and hemoptysis. Blood pressure 110/70 mmHg and heart rate: 105 bpm. Low risk according to simplified pulmonary embolism severity index score. (a) The thrombus is seen within the right middle lobe pulmonary artery (circle) (b) The thrombus is seen extending to a sub-segmental level involving one branch of the right lower lobe pulmonary artery (arrow) (c) Right to left ventricular ratio <1. The calculated pulmonary artery obstruction index for this patient was 22.5% (low-risk group).
DISCUSSION
Rapid risk stratification and appropriate management are important because of the high mortality rate associated with PE. The ESC 2019 APE guidelines[1] emphasize that the severity of APE should be based on an individualized assessment of the early death risk associated with APE.[6] Patients presenting with suspected PE who are hemodynamically unstable (with cardiogenic shock or persistent hypotension) should immediately be stratified as a high risk before any diagnostic workup.[5] However, patients may lack specific clinical symptoms and may be easily misdiagnosed by clinicians (especially at the beginning of the disease) as acute coronary syndromes or other lung diseases.[13]
For hemodynamically stable patients, risk stratification, according to the expected PE-related risk of early death, should take place once PE diagnosis is confirmed to ensure appropriate treatment, with the ultimate aim of identifying those patients who may benefit from more aggressive fibrinolytic therapy.[5]
Conventionally, treatment of submassive PE has been only anticoagulation. However, given the compromise of the RV, other treatments such as systemic low-dose IV thrombolysis and percutaneous interventions such as catheter-directed thrombectomy and thrombolysis may be performed by interventional radiologists.[5]
The degree of pulmonary vascular obstruction is considered the most important factor determining response to APE. The common methods for PAOI calculation are those used by Mastora embolism index[14] and Qanadli et al. embolism index.[12] The evaluation method of Qanadli et al. is widely used for its simple and easy clinical application. In this study, the mean calculated PAOI for patients in our study was 54% ± 18% and ranged between 32.5% and 87.5%. This relatively high PAOI may be due to the referral of most of the patients from emergency, chest, and cardiology departments which led to the inclusion of many high-risk patients.
We detected a high significant correlation between PAOI and sPESI score. Yamashita et al. reported that for patients with sPESI score of 0, the 30-day mortality, recurrent venous thromboembolism, and major bleeding rates were reasonably low.[15]
A significant negative correlation between PAOI and systolic BP (r = −0.247, P = 0.0002) as well as heart rate (r = 0.185, P = 0.001) in our study were found. The high- risk group patients had a much lower BP, HR, and higher PAOI than non-high-risk patients. This results supported by Jeebun et al.[16] and Günay et al..[17] Furthermore, Guo et al.[13] reported different levels of correlation between PAOI and cardiovascular parameters in APE patients. The right ventricular function was most obvious (r = 0.657, P < 0.05). The clinical hemodynamic parameters, that is, systolic BP and tachycardia are usually strongly related to the size of embolus, degree of vascular occlusion, and anatomical extent on CTPA. This may be the reason why PAOI can predict high-risk patients.
The length of hospital stay and mortality also differed significantly between high-risk and non-high-risk patients (P < 0.0001). Günay et al. found that PAOI was correlated with hospital length of stay which is similar to the results of our study (P < 0.0001 and r = 0.65).[17] The low PAOI together with other cardiovascular parameters could be useful to identify candidates for early hospital discharge and reducing the risk of hospital-acquired complications.
Researchers found that an increase of PAOI was a risk factor for death in patients with APE. The negative predictive value of death reached 100% when the PAOI was <40%. Acute right-sided heart failure due to increased pulmonary vascular resistance (PVR) is the prime cause of death in massive PE. The rapid rise in afterload causes dilatation of the right ventricle, which, together with systemic hypotension, compromises coronary perfusion, causing ischemia and sometimes even myocardial infarction. The septal shift resulting from the right ventricle dilatation further reduces left ventricular preload, and the patient enters a “vicious cycle” of acute right-sided heart failure.[18]
On the another hand, Lerche et al.[19] found that thrombotic obstruction of pulmonary vessels did not correlate well with the severity of PE. This is very unusual, but can be explained by that the mechanisms of heart dysfunction and/or failure in PE are more complex and cannot be explained by only mechanical vessel obstruction. RV pressure overload is predominantly related to the interaction between the mechanical pulmonary vascular obstruction and the underlying cardiopulmonary status. Thus, other comorbidities, age, and medical status of the patient may transform a relatively small embolus, involving limited lung segments, into a clinically serious condition.[20]
The presence of RVD may indicate a possibly fatal PE.[14,15] In a meta-analytic study by Vedovati et al.,[21] they found that increased RV/LV diameter ratio measured on transverse CT images conferred the strongest risk with a 5-fold higher risk for PE-related mortality. In the current work, PAOI was significantly correlated with RV/LV ratio (P < 0.0001, r = 0.482). This finding was similar to Langroudi et al.[22] who noticed a significant correlation between PAOI and RV/LV ratio in pulmonary thromboembolism. The mechanical obstruction of the pulmonary vascular tree is the main factor in increased PVR, resulting in pulmonary hypertension and subsequent RVD. Additional factors of pulmonary vasoconstriction include neural reflexes, the release of humoral factors from platelets (i.e., serotonin and platelet-activating factor), plasma (i.e., thrombin and vasoactive peptides C3a, C5a), tissue (i.e., histamine), and systemic arterial hypoxia, all of which are associated with increased RV afterload.[23]
Frémont et al. found that an echocardiographic RV/LV ratio ≥0.9 was shown to be an independent predictor for hospital mortality.[24] Nevertheless, Lim et al.[25] found that RVD/LVD ratio of >1 measured on axial sections is indicative of RV strain at pulmonary CTA. Other investigators have proposed a threshold of greater than 1.5.[26] In this study, for RV/LV ratio >1, ROC curve analysis revealed that the best cutoff value of > 47% for PAOI was associated with the best sensitivity and specificity for predicting RVD. This means that most patients with PAOI above 47% would have RVD.
Attia et al.[27] reported a cutoff point (>43%) for PAOI to be an independent predictor of worse clinical status and RVD in patients with APE. Rodrigues et al.[28] found that the best cutoff point of PAOI with great sensitivity and specificity lies between 40% and 49% and values at these levels or greater will identify more than 90% of patients with the right ventricular dilatation. Guo et al.[13] found that higher PAOI (>52.5%) can predict patients with high risk, for which the sensitivity and specificity were 100% and 81.0%, respectively. Acute RVD would be unlikely when CT obstruction index of <40%.[21]
There are several studies that have proposed an increased RVD/LVD ratio as a predictor of short-term mortality after PE,[29,30] although the prognostic value of this sign remains controversial. Kang et al. reported that cardiac chamber measurements are more reproducible than septal bowing and IVC reflux, for establishing RVD in APE as having more limited interobserver agreement.[31]
In patients without the preexisting cardiopulmonary disease, 25–30% of the pulmonary vasculature must be occluded before the pulmonary artery pressure rises, increasing the RV afterload.[32] Obstruction of pulmonary vessels more than 30% leads to acute pulmonary hypertension and sudden increase in the right ventricular afterload. This may cause RV dilatation and progression to RV failure. The RV compensates until >50–75% of the pulmonary vasculature is overload is further worsened when hypoxia, induced by the emboli, causes localized vasoconstriction by stimulating the release of vasoactive mediators, such as serotonin, thromboxane, and histamine.[33] When afterload has reached the critical level, the RV dilates, the LV underfills and decreases supply to the coronary arteries. Perfusion to the right ventricle drops because there is decreased output to the coronary arteries and increased intramuscular pressure impeding the coronary artery flow, leading to the right ventricular ischemia. In severe cases, low right ventricular output results in systemic hypotension and circulation collapse.[34]
CONCLUSION
Our results further support the use of MDCT pulmonary angiography as a single test for both diagnosis and risk stratification of APE patients. The assessment of pulmonary clot burden through PAOI calculation has a considerable clinical and imaging impact, enabling accurate diagnosis and clot burden estimation. CTPA can be used as an imaging biomarker for the assessment of the right ventricle overload and dysfunction which is associated with increased mortality. This criterion may be of value in selecting cases of submassive/intermediate PE with a poor prognosis who could benefit from thrombolytic treatment.
Declaration of patient consent
Patient’s consent not required as patients identity is not disclosed or compromised.
Financial support and sponsorship
Nil.
Conflicts of interest
There are no conflicts of interest.
References
- 2019 ESC Guidelines for the diagnosis and management of acute pulmonary embolism developed in collaboration with the European Respiratory Society (ERS) Eur Heart J. 2019;1:1-61.
- [CrossRef] [PubMed] [Google Scholar]
- Pulmonary embolism, Part I: Epidemiology, risk factors and risk stratification, pathophysiology, clinical presentation, diagnosis, and nonthrombotic pulmonary embolism. Exp Clin Cardiol. 2013;18:129-38.
- [Google Scholar]
- Management of massive and nonmassive pulmonary embolism. Arch Med Sci. 2012;8:957-69.
- [CrossRef] [PubMed] [Google Scholar]
- Management of massive and submassive pulmonary embolism, iliofemoral deep vein thrombosis, and chronic thromboembolic pulmonary hypertension: A scientific statement from the American Heart Association. Circulation. 2011;123:1788-830.
- [CrossRef] [PubMed] [Google Scholar]
- 2014 ESC guidelines on the diagnosis and management of acute pulmonary embolism. Eur Heart J. 2014;35:3033-80.
- [CrossRef] [PubMed] [Google Scholar]
- Thrombolysis for pulmonary embolism and risk of all-cause mortality, major bleeding, and intracranial hemorrhage: A meta-analysis. JAMA. 2014;311:2414-21.
- [CrossRef] [PubMed] [Google Scholar]
- Pulmonary embolism: The diagnosis, risk-stratification, treatment and disposition of emergency department patients. Clin Exp Emerg Med. 2016;3:117-25.
- [CrossRef] [PubMed] [Google Scholar]
- Trends in the use of diagnostic imaging in patients hospitalized with acute pulmonary embolism. Am J Cardiol. 2004;93:1316-7.
- [CrossRef] [PubMed] [Google Scholar]
- The role of computed tomography in the diagnosis of acute and chronic pulmonary embolism. Diagn Interv Radiol. 2015;21:307-16.
- [CrossRef] [PubMed] [Google Scholar]
- Quantification of right ventricular function in acute pulmonary embolism: Relation to extent of pulmonary perfusion defects. Eur J Echocardiogr. 2008;9:641-5.
- [CrossRef] [PubMed] [Google Scholar]
- New CT index to quantify arterial obstruction in pulmonary embolism: Comparison with angiographic index and echocardiography. Am J Roentgenol. 2001;176:1415-20.
- [CrossRef] [PubMed] [Google Scholar]
- Health risk stratification based on computed tomography pulmonary artery obstruction index for acute pulmonary embolism. Sci Rep. 2018;8:1-8.
- [CrossRef] [PubMed] [Google Scholar]
- Severity of acute pulmonary embolism: Evaluation of a new spiral CT angiographic score in correlation with echocardiographic data. Eur Radiol. 2003;13:29-35.
- [CrossRef] [PubMed] [Google Scholar]
- Validation of simplified PESI score for identification of low-risk patients with pulmonary embolism: From the COMMAND VTE Registry. Eur Hear J Acute Cardiovasc Care. 2018;11:204887261879999.
- [CrossRef] [PubMed] [Google Scholar]
- Are clinical parameters and biomarkers predictive of severity of acute pulmonary emboli on CTPA? QJM. 2010;103:91-7.
- [CrossRef] [PubMed] [Google Scholar]
- Can platelet indices predict obstruction level of pulmonary vascular bed in patients with acute pulmonary embolism? Clin Respir J. 2014;8:33-40.
- [CrossRef] [PubMed] [Google Scholar]
- Pathophysiology and treatment of haemodynamic instability in acute pulmonary embolism: The pivotal role of pulmonary vasoconstriction. Cardiovasc Res. 2000;48:23-33.
- [CrossRef] [Google Scholar]
- Pulmonary vessel obstruction does not correlate with severity of pulmonary embolism. J Clin Med. 2019;8:584.
- [CrossRef] [PubMed] [Google Scholar]
- Acute pulmonary embolism: Risk assessment, risk stratification and treatment options. Clin Respir J. 2016;10:545-54.
- [CrossRef] [PubMed] [Google Scholar]
- Prognostic role of embolic burden assessed at computed tomography angiography in patients with acute pulmonary embolism: Systematic review and meta-analysis. J Thromb Haemost. 2013;11:2092-102.
- [CrossRef] [PubMed] [Google Scholar]
- The association between the pulmonary arterial obstruction index and atrial size in patients with acute pulmonary embolism. Radiol Res Pract. 2019;2019:6025931.
- [CrossRef] [PubMed] [Google Scholar]
- Neurogenic and humoral vasoconstriction in acute pulmonary thromboembolism. Anesth Analg. 2003;97:341-54.
- [CrossRef] [PubMed] [Google Scholar]
- Prognostic value of echocardiographic right/left ventricular end-diastolic diameter ratio in patients with acute pulmonary embolism: Results from a monocenter registry of 1,416 patients. Chest. 2008;133:358-62.
- [CrossRef] [PubMed] [Google Scholar]
- Right ventricular dysfunction secondary to acute massive pulmonary embolism detected by helical computed tomography pulmonary angiography. Clin Imaging. 2005;29:16-21.
- [CrossRef] [PubMed] [Google Scholar]
- Severity assessment of acute pulmonary embolism: Evaluation using helical CT. Eur Radiol. 2003;13:1508-14.
- [CrossRef] [PubMed] [Google Scholar]
- Evaluation of acute pulmonary embolism by sixty-four slice multidetector CT angiography: Correlation between obstruction index, right ventricular dysfunction and clinical presentation. Eur Respir J. 2015;46(Suppl 59):PA3746.
- [CrossRef] [Google Scholar]
- Clot burden score in the evaluation of right ventricular dysfunction in acute pulmonary embolism: Quantifying the cause and clarifying the consequences. Rev Port Cardiol. 2012;31:687-95.
- [CrossRef] [PubMed] [Google Scholar]
- Right ventricular enlargement on chest computed tomography: Prognostic role in acute pulmonary embolism. Circulation. 2004;109:2401-4.
- [CrossRef] [PubMed] [Google Scholar]
- Right ventricular enlargement on chest computed tomography. Circulation. 2004;110:3276-80.
- [CrossRef] [PubMed] [Google Scholar]
- Reproducibility of CT signs of right ventricular dysfunction in acute pulmonary embolism. Am J Roentgenol. 2010;194:1500-6.
- [CrossRef] [PubMed] [Google Scholar]
- Pathophysiology of right ventricular failure in acute pulmonary embolism and chronic thromboembolic pulmonary hypertension: A pictorial essay for the interventional radiologist. Insights Imaging. 2019;10:18.
- [CrossRef] [PubMed] [Google Scholar]
- Acute right ventricular failure in the setting of acute pulmonary embolism or chronic pulmonary hypertension: A detailed review of the pathophysiology, diagnosis, and management. Curr Cardiol Rev. 2008;4:49-59.
- [CrossRef] [PubMed] [Google Scholar]
- Right coronary artery flow impairment in patients with pulmonary hypertension. Eur Heart J. 2008;29:120-7.
- [CrossRef] [PubMed] [Google Scholar]