Translate this page into:
The role of 3-Tesla magnetic resonance perfusion and spectroscopy in distinguishing glioblastoma from solitary brain metastasis

*Corresponding author: Nguyen Minh Duc, Department of Radiology, Pham Ngoc Thach University of Medicine, Ho Chi Minh City, Vietnam. bsnguyenminhduc@pnt.edu.vn
-
Received: ,
Accepted: ,
How to cite this article: Duy Hung N, Van Dung L, Ha Vi N, Hai Anh N, Hong Phuong L, Dinh Hieu N, et al. The role of 3-Tesla magnetic resonance perfusion and spectroscopy in distinguishing glioblastoma from solitary brain metastasis. J Clin Imaging Sci 2023;13:19.
Abstract
Objectives:
This study aimed to assess the value of magnetic resonance perfusion (MR perfusion) and magnetic resonance spectroscopy (MR spectroscopy) in 3.0-Tesla magnetic resonanceimaging (MRI) for differential diagnosis of glioblastoma (GBM) and solitary brain metastasis (SBM).
Material and Methods:
This retrospective study involved 36 patients, including 24 cases of GBM and 12 of SBM diagnosed using histopathology. All patients underwent a 3.0-Tesla MRI examination with pre-operative MR perfusion and MR spectroscopy. We assessed the differences in age, sex, cerebral blood volume (CBV), relative CBV (rCBV), and the metabolite ratios of choline/N-acetylaspartate (Cho/NAA) and Cho/creatine between the GBM and SBM groups using the Mann–Whitney U-test and Chi-square test. The cutoff value, area under the curve, sensitivity, specificity, positive predictive value, and negative predictive value of the significantly different parameters between these two groups were determined using the receiver operating characteristic curve.
Results:
In MR perfusion, the CBV of the peritumoral region (pCBV) had the highest preoperative predictive value in discriminating GBM from SBM (cutoff: 1.41; sensitivity: 70.83%; and specificity: 83.33%), followed by the ratio of CBV of the solid tumor component to CBV of normal white matter (rCBVt/n) and the ratio of CBV of the pCBV to CBV of normal white matter (rCBVp/n). In MR spectroscopy, the Cho/NAA ratio of the pCBV (pCho/NAA; cutoff: 1.02; sensitivity: 87.50%; and specificity: 75%) and the Cho/NAA ratio of the solid tumor component (tCho/NAA; cutoff: 2.11; sensitivity: 87.50%; and specificity: 66.67%) were significantly different between groups. Moreover, combining these remarkably different parameters increased their diagnostic utility for distinguishing between GBM and SBM.
Conclusion:
pCBV, rCBVt/n, rCBVp/n, pCho/NAA, and tCho/NAA are useful indices for differentiating between GBM and SBM. Combining these indices can improve diagnostic performance in distinguishing between these two tumors.
Keywords
Perfusion
Spectroscopy
Glioblastoma
Brain metastasis

INTRODUCTION
Glioblastoma (GBM) and brain metastases are the two most common tumors in adults, with GBM accounting for 16% of primary intracranial tumors and 55% of gliomas.[1] Brain metastases account for 10–26% of intracranial tumors, of which only 25–30% are monofocal.[2,3] Cases with multifocal brain metastases or previous malignancies are diagnosed on routine magnetic resonance imaging (MRI). However, discriminating between solitary brain metastasis (SBM) and GBM when no primary malignancy has been detected is quite difficult because both tumors appear similar on images, with central necrosis, irregular margins, surrounding edema, ring enhancement, and often calcification and bleeding.[4,5] The differential diagnosis of these two tumors is essential for treatment planning and patient outcome prediction.[6-9] The treatment for GBM is maximal resection, radiation therapy, and chemotherapy with temozolomide.[10] In contrast, SBM is treated with stereotactic radiosurgery or surgical resection combined with whole-brain radiation after surgery, depending on the size and location of the tumor.[11,12] Pathology is the gold standard for discriminating between these two tumors at the cellular level. However, accessing tumors in deep or functional areas for surgery or biopsies can be challenging.[13,14]
Conventional MRI with contrast injection is an effective method of diagnosing brain tumors. However, its diagnostic capacity is limited. The rate of incorrect differential diagnosis of GBM and SBM on routine MRI is up to 40%.[15,16] The area around the tumor is critical for distinguishing between these two types. In GBM, the peritumoral region is a combination of vasogenic edema and tumor cell infiltration, whereas, in SBM, the peritumoral part is purely vasogenic edema.[12,17] Some advanced techniques, especially magnetic resonance perfusion (MR perfusion) and magnetic resonance spectroscopy (MR spectroscopy), have been applied to analyze the peritumoral region to differentiate between GBM and SBM. MR perfusion allows quantitative and qualitative assessment of tumor angiogenesis and peritumoral edema without being affected by blood-brain barrier disruption. Relative cerebral blood volume (rCBV) maps are used to quantify areas of angiogenesis.[18,19] MR spectroscopy provides metabolic information on brain tumors by measuring specific amino acids, such as N-acetylaspartate (NAA), choline (Cho), creatine (Cr), lipid, and lactate and their ratios in the tumor area and the peritumor edema area.[20,21]
Several studies have focused on the use of MR perfusion and MR spectroscopy and their combination with other techniques, such as diffusion-weighted imaging and diffusion tensor imaging, in the differential diagnosis of GBM and SBM.[12,15,18-20] However, only a few studies have considered the value of combining MR perfusion and MR spectroscopy in the differential diagnosis of these two types of tumors, and the results are inconsistent.[18,22-24] Therefore, we assessed the value of MR perfusion and MR spectroscopy in 3.0-Tesla MRI for distinguishing between GBM and SBM.
MATERIAL AND METHODS
Study population
This cohort study consisted of 36 patients who were preoperatively imaged using 3.0-Tesla MRI with conventional sequences, dynamic susceptibility contrast (DSC) MR perfusion, and multivoxel MR spectroscopy at Viet Duc Hospital, Hanoi, Vietnam, from January 2020 to October 2022. All patients underwent biopsy or surgery and were histopathologically diagnosed. Patients were divided into two study groups based on the histopathological diagnosis of GBM (24 patients) and SBM (12 patients). Our study was approved by the Ethics Committee (QD: 2682/QDĐHYHN July 13, 2021) and conformed to the principles of the Declaration of Helsinki. The Hanoi Medical University Review Board waived the patient or guardian consent requirement because the study was a retrospective and involved analysis of anonymized image data.
MRI
The imaging examinations were performed on a 3.0-Tesla MRI scanner (GE SIGNA™ Pioneer, GE Healthcare, Chicago, IL, USA) using a head coil with conventional sequences including T1-weighted (T1W) spin echo, fluid-attenuated inversion recovery (FLAIR), T2-weighted (T2W) gradient echo, and diffusion-weighted imaging with apparent diffusion coefficient map reconstruction with the protocol applied to all patients [Table 1]. DSC perfusion was performed during the first pass of a bolus contrast injection before T1W post-contrast images were acquired. Dynamic T2*-weighted gradient-recall echo-planar imaging was used with the same slide thickness as for FLAIR or T2W axial sequences. The correlation between the level of tumor enhancement on T1W after contrast injection and the area of hyperperfusion on the rCBV map was determined. The average value of rCBV was calculated for each group of tumors.
| Sequence | Plane | TR (ms) | TE (ms) | Thickness (mm) | Matrix | FOV | Others |
|---|---|---|---|---|---|---|---|
| FLAIR | Axial | 8500 | 117 | 5 | 184×256 | 240×240 | IR 2500 ms |
| T2 TSE | Axial, coronal | 2500 | 100 | 5 | 360×288 | 220×220 | |
| T2*/SWI | Axial | 360 | 10 | 5 | µ | ||
| DWI | Axial | 5202 | 78 | 5 | 230×240 | ||
| T1 SE | Axial, sagittal | 2325 | 24 | 5 | 240×240 | 300×224 | |
| T1 SE CE+ | Axial, sagittal | 2325 | 24 | 5 | 240×240 | 300×244 | α |
| DSC-MRI | GRE EPI | 1250 | 45 | 5 | 88×87 | 338×240 | β |
| MR spectroscopy | 2D multivoxel CSI | 8500 | 144 | 240×240 | |||
| Voxel 3D CSI | 2000 | 144 | Voxel size of 0.9×1.6×1.2 cm3 | ||||
MRI: Magnetic resonance imaging, TR: Repetition time, TE: Echo time, FOV: Field of view, FLAIR: Fluid-attenuated inversion recovery, IR: Inversion time, T2 TSE: T2-weighted turbo spin echo, SWI: Susceptibility-weighted imaging, DWI: Diffusion-weighted imaging, T1 SE: T1-weighted spin echo, CE+: Contrast enhancement, DSC-MRI: Dynamic susceptibility contrast perfusion MRI, GRE EPI: Gradient-recalled echo-planar imaging, CSI: Chemical shift imaging, µ: Optimal sequence (T2* or SWI) for each patient, α: Intravenous injection of contrast agent (gadolinium-diethylenetriaminepentaacetate [DTPA] at 1 mL/kg, with an injection rate of 5 mL/s), β: Performed before T1-SE CE+during the first pass of an intravenous bolus injection of contrast agent (gadolinium-DTPA at 1 mL/kg, with an injection rate of 5 mL/s), 40 acquisition scans with voxel size 2.5×2.5×5 mm. DSC-MRI was performed using the dynamic T2*-weighted GRE EPI. MR spectroscopy was performed using 2D multivoxel CSI and Voxel 3D CSI
Multivoxel MR spectroscopy was localized using a FLAIR or T1 GE 3D sequence. The average density of metabolites (Cho, NAA, and Cr) and the ratios of metabolites (Cho/NAA and Cho/Cr) of the solid tumor component and peritumoral region were computed to assess the infiltrative nature of the tumor.
Image analysis
The MR findings were read by a neuroradiologist, with more than 10 years of experience, without clinical pathology information. Related lesions on conventional MRI included the following:
The solid tumor component was the enhanced part of post-contrast T1W
The peritumoral region was defined as the region around the solid part of the tumor, hypointense on T1W, and hyperintense on FLAIR, with no contrast enhancement
The contralateral normal white matter area was the normal white matter portion located in the contralateral brain parenchyma on the same plane as the lesion
The cystic degenerating or necrotic tumor region was the lesion significantly hypointense on T1W images and hyperintense on T2W images and without enhancement after injection
Hemorrhagic and calcified areas in the tumor were indicated by T2* hypointensity.
Measurement of cysts, calcifications, necrosis, and juxta-skull base was avoided due to possible signal interference, leading to reduced accuracy. The solid tumor component, pCBV, and contralateral benign white matter are shown in [Figure 1].
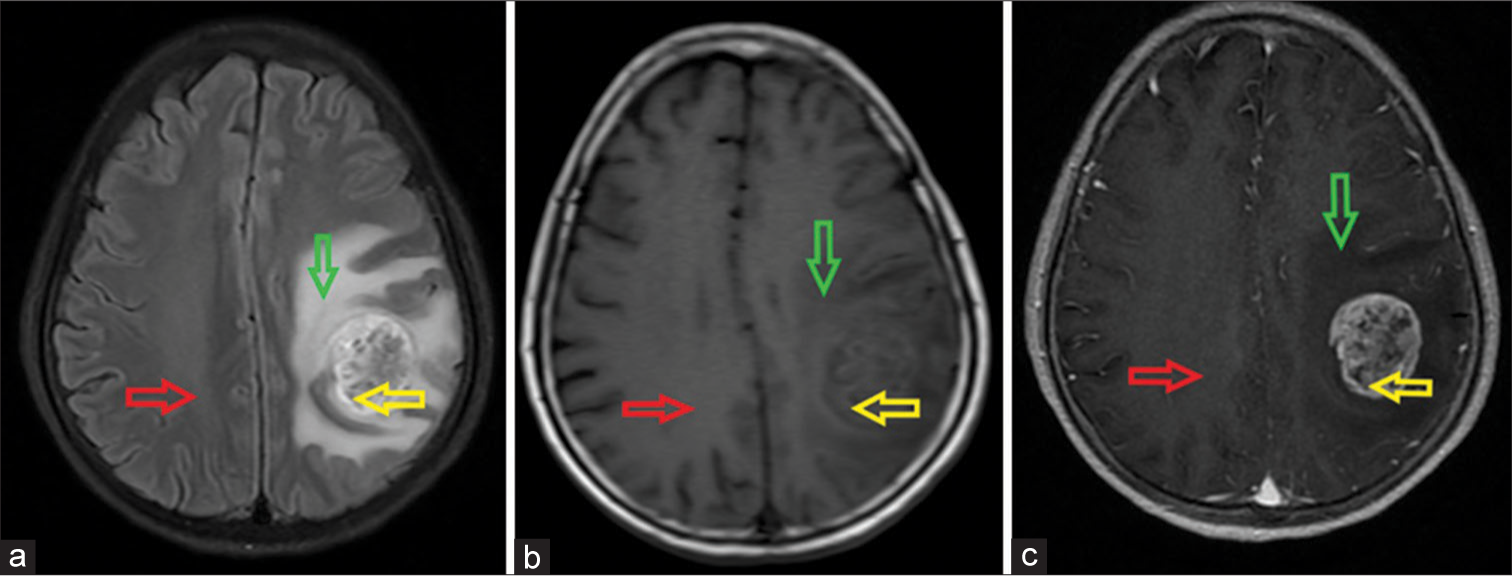
- Left frontal-parietal glioblastoma in a 58-year-old female patient. The locations of the solid tumor component (yellow arrow), peritumoral region (green arrow), and contralateral benign white matter (red arrow) on magnetic resonance imaging. (a) Axial fluid-attenuated inversion recovery image; (b) Non-enhanced axial T1-weighted (T1W) image; and (c) Contrast-enhanced axial T1W image. The tumor is heterogeneously hypointense on T1W with surrounding edema on fluid-attenuated inversion recovery and causes a mass effect that compresses the midline to the right. After contrast, the lesion is strongly enhanced.
Each patient underwent MR spectroscopy with two-dimensional multivoxel chemical shift imaging to measure metabolites in the solid tumor component, peritumoral region, and contralateral benign white matter. Three regions of interest (range of interests [ROIs], ~30 mm2) were located on each of these sites. The concentrations and ratios of metabolites were determined using spectroscopic analysis of the peaks for NAA at 2.18–2.01 parts per million (ppm), Cr at 3.15–3.0 ppm, and Cho at 3.36–3.12 ppm. The software automatically calculated the Cho/NAA and Cho/Cre ratios for the results, as shown in [Figure 2].
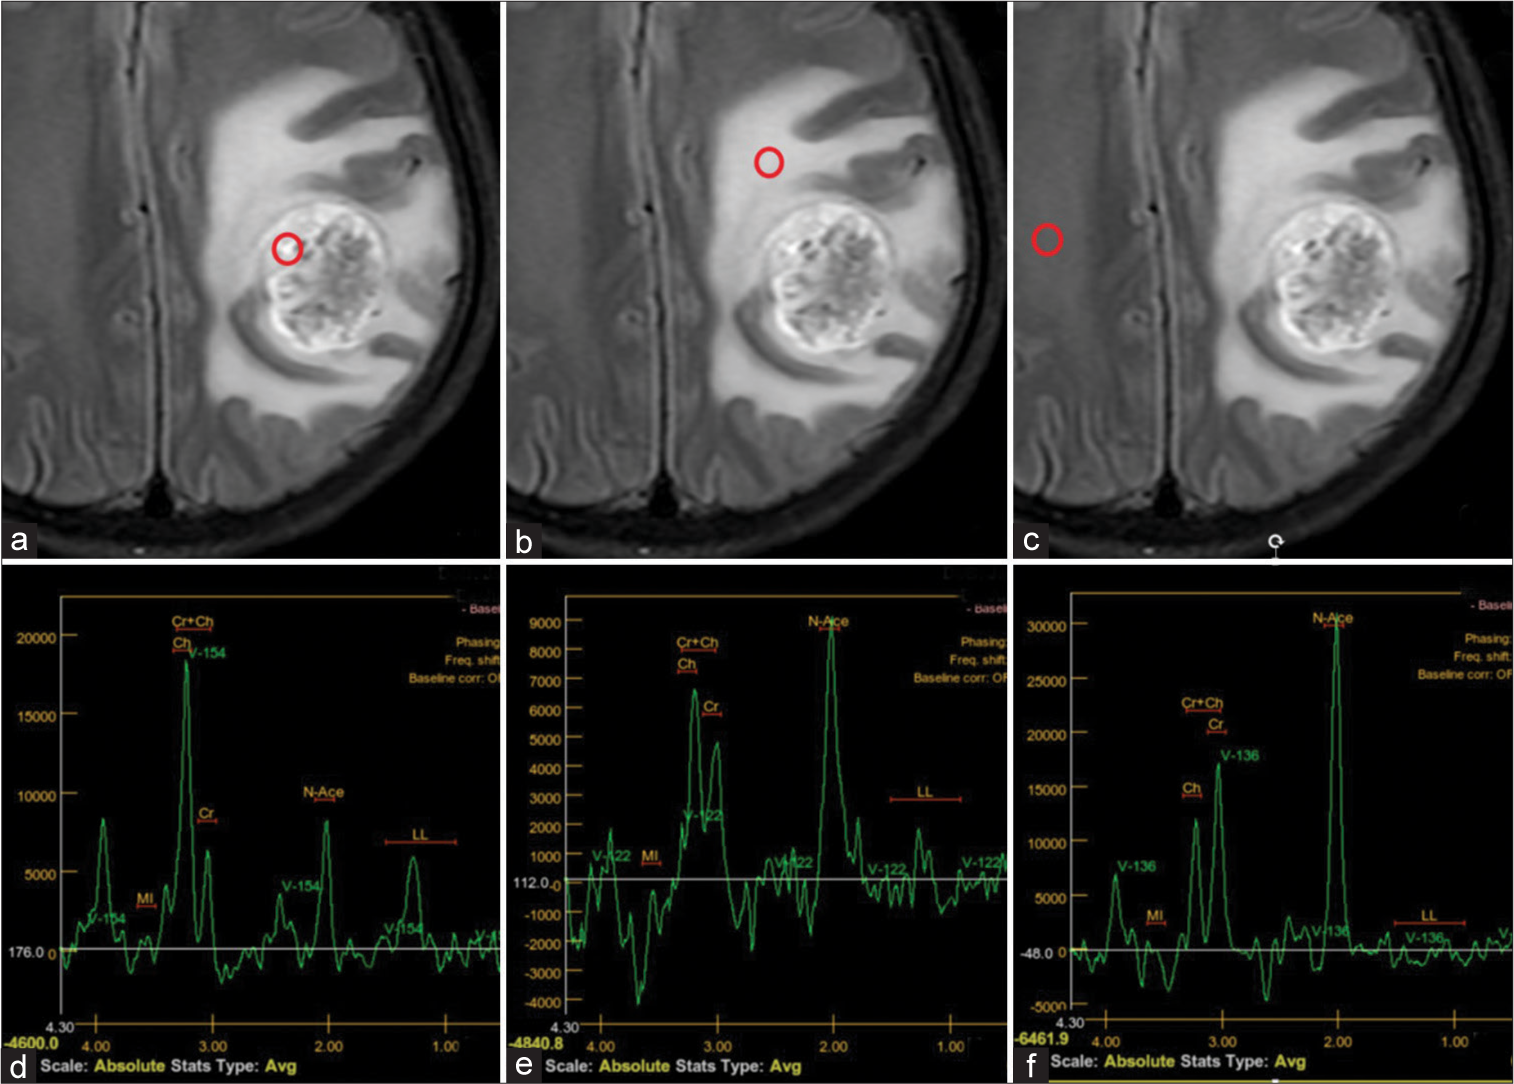
- Left frontal-parietal glioblastoma in a 58-year-old female patient. (a-c) Positions of three regions of interest in the solid tumor component, peritumoral region, and contralateral benign white matter (indicated by red circles). (d-f) Magnetic resonance (MR) spectroscopy in the respective regions. (d) MR spectroscopic data of the solid tumor component reveals choline (Cho) elevation, N-acetylaspartate (NAA) reduction, and an elevated Cho/creatine ratio suggesting a tumor lesion. (e) MR spectroscopy of the peritumoral region shows increasing Cho and an increased Cho/NAA ratio in keeping with tumor infiltration. (f) Normal MR spectroscopy of contralateral benign white matter.
On the CBV map, three ROIs (~30 mm2) were delineated on the solid tumor component, pCBV, and contralateral benign white matter and compared to conventional sequences. The solid part of the tumor was selected as the most hyperperfused part presenting as highly intense on the CBV color scale, excluding confounding areas. The hemodynamic parameter was calculated as rCBV by normalizing the maximum values obtained in the solid part of the tumor and the peritumoral region against contralateral benign white matter [Figure 3].
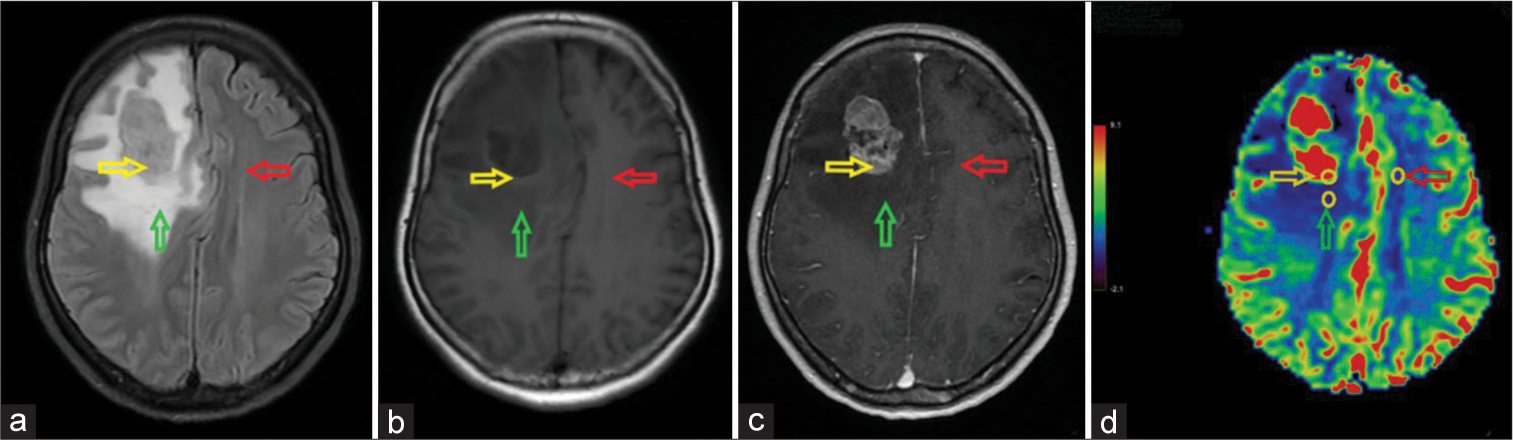
- A right frontal solitary brain metastasis originating from lung cancer in a 50-year-old female patient. The positions of three regions of interest (yellow circles) in the solid tumor component (yellow arrow), peritumoral region (green arrow), and contralateral benign white matter (red arrow). (a) Fluid-attenuated inversion recovery image; (b) Non-enhanced axial T1-weighted image; (c) Contrast-enhanced axial T1-weighted image; and (d) Cerebral blood volume (CBV) map. The tumor is hypointense on T1W with moderate surrounding edema on axial fluid-attenuated inversion recovery, causing a mass effect that compresses the midline to the left, and heterogeneous enhancement. The CBV map shows hyperperfusion of the tumor compared to the surrounding brain tissue.
Statistical analysis
Data were analyzed using SPSS 20.0 (SPSS Inc., Armonk, NY, USA). Quantitative parameters are given as the mean ± standard deviation and qualitative parameters as number (n) and percentage (%). The Mann–Whitney U-test for non-normally distributed variables and independent samples t-test for normally distributed variables were used to compare differences between the GBM and SBM groups. P < 0.05 was considered significant. Indicators found to be significant for differentiating between the two groups and the combinations of these parameters were analyzed using the receiver operating characteristic (ROC) curve to demonstrate their prognostic value.
RESULTS
Patient characteristics are presented in [Table 2]. No significant differences were found in mean age and sex between GBM and SBM (P > 0.05).
| Characteristic | Tumor | -value | |
|---|---|---|---|
| GBM (n=24) | SBM (n=12) | ||
| Age | 57.3±14.9 | 59.8±7.2 | 0.113* |
| Sex | Men: 12 (50.0%) | Men: 5 (41.7%) |
0.637** |
| Women: 12 (50.0%) |
Women: 7 (58.3%) |
||
[Table 3] shows the MR perfusion and MR spectroscopy values in the solid tumor component, pCBV, and contralateral benign white matter in GBM and SBM.
| Parameter | GBM | SBM | P-value |
|---|---|---|---|
| tCBV | 8.972±2.169 | 9.946±3.668 | 0.410* |
| pCBV | 1.978±0.976 | 1.012±0.554 | 0.003* |
| tCho | 116866±55991 | 90498±50897 | 0.179* |
| tNAA | 37328±21059 | 48530±29535 | 0.198* |
| tCre | 34453±20912 | 28558±15734 | 0.476** |
| pCho | 90726±43134 | 61175±40632 | 0.057* |
| pNAA | 67691±34812 | 70980±37344 | 0.560* |
| pCre | 45352±23443 | 40529±22586 | 0.796* |
GBM: Glioblastoma, SBM: Solitary brain metastasis, CBV: Cerebral blood volume, Cho: Choline, NAA: N-acetylaspartate, Cre: Creatine, tCBV: CBV value of the solid tumor component, pCBV: CBV of the peritumoral region, tCho, tNAA, and tCre: Cho, NAA, and Cre concentration, respectively, in the solid tumor component; pCho, pNAA, and pCre: Cho, NAA, and Cre concentration, respectively, in the peritumoral region. *P-value determined by the independent samples test; **P-value determined by the Mann–Whitney U-test. Boldface type indicates statistical significance
The CBV of the peritumoral region (pCBV) in GBM cases was significantly higher than that in SBM cases (P < 0.05). The area under the curve (AUC) for pCBV was 0.823 [Figure 4]. A cutoff value of 1.41 was established to differentiate between GBM and SBM, with a sensitivity of 70.83%, specificity of 83.33%, negative predictive value (NPV) of 89.47%, and positive predictive value (PPV) of 58.82%. The remaining indices were not significantly different between these two tumors (P > 0.05).
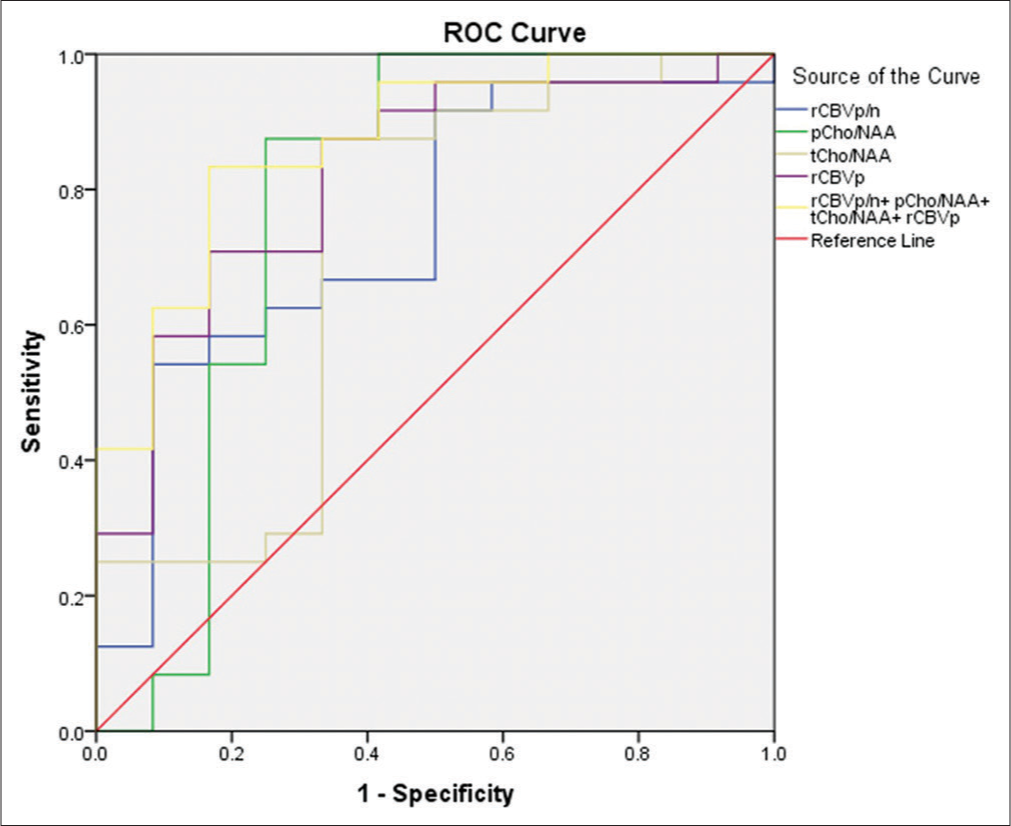
- Receiver operating characteristic curves for cerebral blood volume (CBV) of the peritumoral region (pCBV), the ratio of CBV of the pCBV to CBV of normal white matter (rCBVp/n), the ratio of choline (Cho) to N-acetylaspartate (NAA) in the solid tumor component (tCho/NAA), the ratio of Cho to NAA in the pCBV (pCho/NAA), and the combination of these parameters for differentiating between glioblastoma and solitary brain metastasis.
[Table 4] shows the ratios parameters determined from MR perfusion and MR spectroscopy images of the solid tumor component, pCBV, and contralateral benign white matter in GBM and SBM.
| Parameter | GBM | SBM | P-value |
|---|---|---|---|
| rCBVt/n | 5.354±2.461 | 7.080±2.042 | 0.044* |
| rCBVp/n | 1.099±0.484 | 0.745±0.459 | 0.043* |
| tCho/NAA | 4.600±4.744 | 2.319±1.483 | 0.041** |
| pCho/NAA | 1.402±0.452 | 0.995±0.903 | 0.006** |
| tCho/Cre | 4.115±2.544 | 3.469±1.735 | 0.476** |
| pCho/Cre | 2.145±0.743 | 1.569±0.996 | 0.435* |
GBM: Glioblastoma, SBM: Solitary brain metastasis, CBV: Cerebral blood volume, Cho: Choline, NAA: N-acetylaspartate, Cre: Creatine, rCBVt/n, the ratio of CBV of the solid tumor component to CBV of normal white matter; rCBVp/n, the ratio of CBV of the peritumoral region to CBV of normal white matter; tCho/NAA, the ratio of Cho to NAA in the solid tumor component; pCho/NAA, the ratio of Cho to NAA in the peritumoral region; tCho/Cre, the ratio of Cho to Cre in the solid tumor component; pCho/Cre, and the ratio of Cho to Cre in the peritumoral region. *P-value determined by independent samples test; **P-value determined by Mann– Whitney U-test. Boldface type indicates statistical significance
The ratio of CBV of the solid tumor component to CBV of normal white matter (rCBVt/n) in GBM cases was significantly lower than that in SBM cases (P < 0.05). The AUC for pCBV was 0.757 [Figure 5]. A cutoff value of 5.21 was established to differentiate between GBM and SBM, with a sensitivity of 62.50%, specificity of 91.67%, NPV of 55.00%, and PPV of 93.75%.
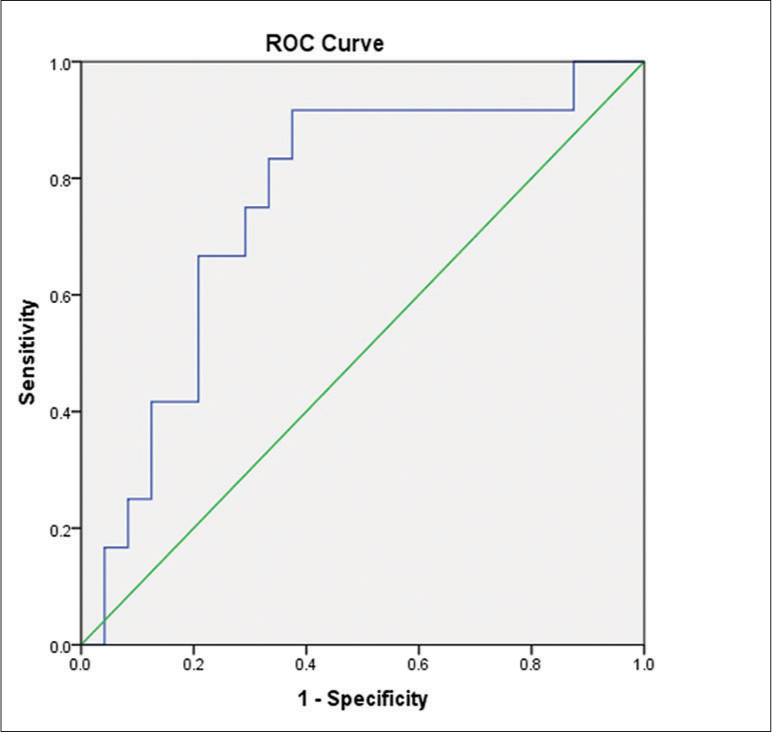
- Receiver operating characteristic curve for the ratio of cerebral blood volume (CBV) of the solid tumor component to CBV of normal white matter for differentiating between glioblastoma and solitary brain metastasis.
The ratio of CBV of the peritumoral region to CBV of normal white matter (rCBVp/n), the ratio of Cho/NAA in the solid tumor component (tCho/NAA), and the ratio of Cho/NAA in the peritumoral region (pCho/NAA) in GBM cases were significantly higher than those in SBM cases (P < 0.05). The AUC for rCBVp/n, tCho/NAA, and pCho/NAA were 0.743, 0.712, and 0.781, respectively [Figure 4].
[Table 5] shows the cutoff value, AUC, sensitivity, specificity, PPV, and NPV of each of the parameters significantly different between GBM and SBM. The combination of all four significantly different metrics (pCBV, rCBVp/n, tCho/NAA, and pCho/NAA) resulted in an AUC of 0.872 [Figure 4]. The sensitivity, specificity, NPV, and PPV of this combination were 90.91%, 71.43%, 83.33%, and 83.33%, respectively.
| Parameters | Cutoff | AUC | Se (%) | Sp (%) | NPV (%) | PPV (%) |
|---|---|---|---|---|---|---|
| pCBV | 1.41 | 0.819 | 70.83 | 83.33 | 89.47 | 58.82 |
| rCBVt/n | 5.21 | 0.757 | 62.50 | 91.67 | 55.00 | 93.75 |
| rCBVp/n | 1.04 | 0.743 | 54.16 | 91.67 | 92.86 | 50.00 |
| tCho/NAA | 2.11 | 0.712 | 87.50 | 66.67 | 84.00 | 72.73 |
| pCho/NAA | 1.02 | 0.781 | 87.50 | 75.00 | 87.50 | 81.82 |
| pCBV+rCBVp/n+tCho/NAA+pCho/NAA | 0.55 | 0.868 | 95.45 | 78.57 | 87.50 | 91.67 |
GBM: Glioblastoma, SBM: Solitary brain metastasis, CBV: Cerebral blood volume, Cho: Choline, NAA: N-acetyl aspartate, Cre: Creatine, pCBV: Peritumoral region CBV value, rCBVt/n, the ratio of CBV value of the solid tumor component relative to that in the normal white matter; rCBVp/n, the ratio of CBV value of the peritumoral region relative to that in the normal white matter; tCho/NAA, the ratio of Cho/NAA in the solid tumor component; pCho/NAA, and the ratio of Cho/NAA in the peritumoral region.
DISCUSSION
Differentiation between GBM and SBM is important for treatment planning and patient outcomes.[6-9] Due to the similar clinical and imaging features of these two tumors, GBM is often confused with SBM and vice versa during diagnosis.[15,16] We studied the differences in peritumoral areas between the two tumor types. Peritumoral edema in GBM is a combination of vasogenic edema and tumor cell infiltration, whereas that in SBM is pure vasogenic edema.[12,17,25] Advanced MR techniques such as perfusion and spectroscopy, which evaluate peritumoral tumor infiltrates, help to differentiate between these two tumors.
Similar to the results of Jung et al.,[17] the findings of our 36-patient study showed that both types of tumors are more common in individuals more than 50 years of age and are found in both sexes with no significant difference. In DSC perfusion, the difference in tCBV values was not statistically significant (P > 0.05), the tCBV of GBM was 8.972 ± 2.169, and the latter’s group value was 9.122 ± 4.442. This conclusion is similar to those of the previous studies.[12,25,26] On the other hand, the pCBV of the GBM group was significantly higher than that of the SBM group (1.978 ± 0.976 vs. 0.943 ± 0.615; P < 0.05). This difference is due to the histology of the peritumoral area of these two tumor types. This region is a combination of vasogenic edema and tumor cell infiltrates in GBM and, therefore, has increased angiogenesis, which is indicated by a higher rCBV than that of SBM, which shows only vasogenic cerebral edema.[12,17,25] Our pCBV results for GBM were higher than those of Tong et al. (1.8 ± 0.7),[27] Tsougos et al. (1.68 ± 0.59),[26] and Romano et al. (1.46).[25] pCBV of SBM in our study was also higher than that of Tong et al. (0.6 ± 0.1),[27] and Romano et al. (0.87)[25] but lower than Tsougos et al.’ result of 1.06 ± 0.38.[26] Although there is a difference in results between our study and previous studies, this difference is not remarkable. pCBV, higher in GBM than in SBM, is an important indicator for distinguishing between these two types of tumors. When calculating rCBV for the tumor area and the peritumor area with normal white matter on the opposite side, we also obtained ratios with statistically significant differences between tumor types (P < 0.05; Table 4).
Magnetic resonance spectroscopy showed that the mean values of metabolites were not significantly different between GBM and SBM (P > 0.05; Table 3). However, tCho/NAA of GBM was significantly higher than that of SBM (4.600 ± 4.744 vs. 2.319 ± 1.483; P < 0.05). Compared to Tsougos et al.’s study, tCho/NAA of GBM in our study was slightly higher and that of SBM was lower.[26] In addition, we also found that GBM had a significantly higher pCho/NAA ratio than SBM (1.402 ± 0.452 vs. 0.995 ± 0.903; P < 0.05). These differences can also be explained by the differences in the histology of the pCBV of these two types of tumors described above. This ratio represents the infiltration and spread of tumor cells and is helpful in the differential diagnosis of GBM and SBM. We simultaneously calculated the average value of the ratio of Cho to Cr in the tumor region (tCho/Cre) and peritumor area (pCho/Cre) of the GBM group and the SBM group; the results showed that the GBM group had higher tCho/Cre and pCho/Cre ratios than the SBM group. This result is similar to the findings of Arévalo-Sáenz[28] and Server et al.[29]
We used ROC curves to analyze the sensitivity and specificity of cutoff values of statistically significant factors. The pCBV cutoff at 1.41 had an AUC, sensitivity, and specificity of 80.30%, 70.83%, and 83.33%, respectively. In Tsougos’ study of 49 patients, the cutoff was 1.7, which had higher sensitivity and specificity (80% and 94%, respectively) than our cutoff.[26] In our study, the cutoff of tCho/NAA at 2.11 had an AUC of 71.2%, sensitivity of 87.50%, and specificity of 66.67%, with a PPV of 84.00% and an NPV of 72.73% [Table 5]. In contrast, Tsougos did not find a statistically significant difference between the two groups.[26] The pCho/NAA ratio with a cutoff of 1.02 in our study had an AUC of 78.1%, sensitivity of 87.50%, and specificity of 75.00%. The cutoff of 1.115 for pCho/NAA in Arévalo-Sáenz’s study had higher sensitivity and specificity (93.87% and 93.33%, respectively).[28] In addition, the pCho/NAA cutoff of 1.10 in Tsougos et al.’s study had lower sensitivity (78%) but higher specificity (93%) than that in our study.[26]
Finally, we analyzed the diagnostic value of combining MR spectroscopy and MR perfusion in differential diagnosis of GBM and SBM tumors [Table 5, Figures 4 and 5] by combining the significantly different values. We found an increased AUC of 86.80%, with a cutoff of 0.55 having a sensitivity of 95.45% and specificity of 78.57%. This showed that combining sequences increased the reliability of the indicators in distinguishing between the two tumors.[25]
Our study has some limitations. First, it had a small sample size, which might have led to bias in assessing diagnostic efficiency. Second, the measurements might have been affected in some cases due to tumoral heterogeneity, including hemorrhage, calcification, necrosis, or adjacent bone.
CONCLUSION
Our study showed that advanced MRI techniques, including perfusion and spectroscopy, can be used to differentiate between GBM and SBM. The parameters with high diagnostic value for differentiating between these two tumors were pCBV and pCho/NAA, with cutoff values of 1.41 and 1.02, respectively. The combination of these ratios increases the diagnostic performance of MRI in distinguishing between the two tumors.
Declaration of patient consent
The Institutional Review Board (IRB) permission was obtained for the study.
Conflicts of interest
There are no conflicts of interest.
Financial support and sponsorship
Nil.
References
- The 2007 WHO classification of tumours of the central nervous system. Acta Neuropathol. 2007;114:97-109. Erratum in: Acta Neuropathol 2007;114:547
- [CrossRef] [PubMed] [Google Scholar]
- Single brain metastasis. Curr Treat Options Neurol. 2001;3:89-99.
- [CrossRef] [PubMed] [Google Scholar]
- Differentiation between glioblastoma multiforme and metastasis from the lungs and other sites using combined clinical/routine MRI radiomics. Front Cell Dev Biol. 2021;9:710461.
- [CrossRef] [PubMed] [Google Scholar]
- Cost of migration: Invasion of malignant gliomas and implications for treatment. J Clin Oncol. 2003;21:1624-36.
- [CrossRef] [PubMed] [Google Scholar]
- Robust performance of deep learning for distinguishing glioblastoma from single brain metastasis using radiomic features: Model development and validation. Sci Rep. 2020;10:12110.
- [CrossRef] [PubMed] [Google Scholar]
- A multiparametric MR-based radiofusionomics model with robust capabilities of differentiating glioblastoma multiforme from solitary brain metastasis. Cancers (Basel). 2021;13:5793.
- [CrossRef] [PubMed] [Google Scholar]
- Predicting survival duration with MRI radiomics of brain metastases from non-small cell lung cancer. Front Oncol. 2021;11:621088.
- [CrossRef] [PubMed] [Google Scholar]
- Radiomic features from multi-parameter MRI combined with clinical parameters predict molecular subgroups in patients with medulloblastoma. Front Oncol. 2020;10:558162.
- [CrossRef] [PubMed] [Google Scholar]
- European Association for Neuro-Oncology (EANO) guideline for the diagnosis and treatment of anaplastic gliomas and glioblastoma. Lancet Oncol. 2014;15:e395-403. Erratum in: Lancet Oncol 2014;15:e587
- [CrossRef] [PubMed] [Google Scholar]
- Differentiating glioblastomas from solitary brain metastases: An update on the current literature of advanced imaging modalities. Cancers (Basel). 2021;13:2960.
- [CrossRef] [PubMed] [Google Scholar]
- Neuroendoscopic biopsy of brain lesions: Accuracy and complications. J Neurosurg. 2015;122:34-9.
- [CrossRef] [PubMed] [Google Scholar]
- Serial stereotactic biopsy of brainstem lesions in adults improves diagnostic accuracy compared with MRI only. J Neurol Neurosurg Psychiatry. 2009;80:1134-9.
- [CrossRef] [PubMed] [Google Scholar]
- Discrimination between metastasis and glioblastoma multiforme based on morphometric analysis of MR images. AJNR Am J Neuroradiol. 2011;32:67-73.
- [CrossRef] [PubMed] [Google Scholar]
- Classification of brain tumours using short echo time 1H MR spectra. J Magn Reson. 2004;170:164-75.
- [CrossRef] [PubMed] [Google Scholar]
- Differentiation between glioblastoma and solitary metastasis: Morphologic assessment by conventional brain MR imaging and diffusion-weighted imaging. Investig Magn Reson Imaging. 2021;25:23-34.
- [CrossRef] [Google Scholar]
- Distinction between high-grade gliomas and solitary metastases using peritumoral 3-T magnetic resonance spectroscopy, diffusion, and perfusion imagings. Neuroradiology. 2004;46:619-27.
- [CrossRef] [PubMed] [Google Scholar]
- MR diffusion tensor and perfusion-weighted imaging in preoperative grading of supratentorial nonenhancing gliomas. Neuro Oncol. 2011;13:447-55.
- [CrossRef] [PubMed] [Google Scholar]
- A systematic literature review of magnetic resonance spectroscopy for the characterization of brain tumors. AJNR Am J Neuroradiol. 2006;27:1404-11.
- [Google Scholar]
- Combination of single-voxel proton MR spectroscopy and apparent diffusion coefficient calculation in the evaluation of common brain tumors. AJNR Am J Neuroradiol. 2003;24:225-33.
- [Google Scholar]
- Differentiation between high-grade glioma and metastatic brain tumor using single-voxel proton MR spectroscopy. Eur Radiol. 2001;11:1784-91.
- [CrossRef] [PubMed] [Google Scholar]
- Perfusion, diffusion and spectroscopy values in newly diagnosed cerebral gliomas. NMR Biomed. 2006;19:463-75.
- [CrossRef] [PubMed] [Google Scholar]
- Perfusion and spectroscopy magnetic resonance imaging in a case of lymphocytic vasculitis mimicking brain tumor. Pol J Radiol. 2013;78:66-9.
- [CrossRef] [PubMed] [Google Scholar]
- Single brain metastasis versus glioblastoma multiforme: A VOI-based multiparametric analysis for differential diagnosis. Radiol Med. 2022;127:490-7.
- [CrossRef] [PubMed] [Google Scholar]
- Differentiation of glioblastoma multiforme from metastatic brain tumor using proton magnetic resonance spectroscopy, diffusion and perfusion metrics at 3 T. Cancer Imaging. 2012;12:423-36.
- [CrossRef] [PubMed] [Google Scholar]
- Advanced imaging of brain metastases: From augmenting visualization and improving diagnosis to evaluating treatment response. Front Neurol. 2020;11:270.
- [CrossRef] [PubMed] [Google Scholar]
- High-grade glioma and solitary metastasis: Differentiation by spectroscopy and advanced magnetic resonance techniques. Egypt J Neurosurg. 2022;37:34.
- [CrossRef] [Google Scholar]
- Quantitative apparent diffusion coefficients in the characterization of brain tumors and associated peritumoral edema. Acta Radiol. 2009;50:682-9.
- [CrossRef] [PubMed] [Google Scholar]