Translate this page into:
Intrapatient variability of 18F-FDG uptake in normal tissues


*Corresponding author: Mohamed Hosny Mohamed Sayed, Department of Clinical Oncology and Nuclear Medicine, Faculty of Medicine, Assiut University, Assiut, Egypt. mkeshk2010@gamil.com
-
Received: ,
Accepted: ,
How to cite this article: Mohamed Sayed MH, Abdelnaim AK, Mohamadien NR. Intrapatient variability of 18F-FDG uptake in normal tissues. J Clin Imaging Sci 2022;12:37.
Abstract
Objectives
To investigate the effect of serum glucose level and other confounding factors on the variability of maximum standardized uptake value (SUVmax) in normal tissues within the same patient on two separate occasions and to suggest an ideal reference tissue.
Materials and Methods
We retrospectively reviewed 334 18F-FDG PET/CT scans of 167 cancer patients including 38 diabetics. All patients had two studies, on average 152 ± 68 days apart. Ten matched volumes of interest were drawn on the brain, right tonsil, blood pool, heart, lung, liver, spleen, bone marrow, fat, and iliopsoas muscle opposite third lumber vertebra away from any pathological 18F-FDG uptake to calculate SUVmax.
Results
SUVmax of the lungs and heart were significantly different in the two studies (P = 0.003 and P = 0.024 respectively). Only the brain uptake showed a significant moderate negative correlation with the level of blood glucose in diabetic patients (r = −0.537, P = 0.001) in the first study, while the SUVmax of other tissues showed negligible or weak correlation with the level of blood glucose in both studies.
The liver showed significant moderate positive correlation with body mass index (BMI) in both studies (r = .416, P = <0.001 versus r = 0.453, P = <0.001, respectively), and blood pool activity showed significant moderate positive correlation with BMI in the first study only (r = 0.414, P = <0.001). The liver and blood pool activities showed significant moderate negative correlation with 18F-FDG uptake time in first study only (r = −0.405, P-value = <0.001; and r = −0.409, P-value = <0.001, respectively).
In the multivariate analysis, the liver showed a consistent effect of the injected 18F-FDG dose and uptake duration on its SUVmax on the two occasions. In comparison, spleen and muscle showed consistent effect only of the injected dose on the two occasions.
Conclusion
The liver, muscle, and splenic activities showed satisfactory test/retest stability and can be used as reference activities. The spleen and muscle appear to be more optimal reference than the liver, as it is only associated with the injected dose of 18F-FDG.
Keywords
18F-FDG PET/CT
Intrapatients
Blood glucose
Normal tissues

INTRODUCTION
Evaluation of tumor metabolism by positron emission tomography/computed tomography (PET/CT), commonly done using radiolabelled 2-deoxy-2-[18F]fluoro-D-glucose (18F-FDG).[1] Clinically, image analysis was done qualitatively by visual comparison of the metabolism in the lesions to that in the normal tissues, or semi-quantitatively using maximum standardized uptake value (SUVmax) which is the most widely accepted semi-quantitative parameter used to measure tracer accumulation in tissues and hence tissue metabolism.[2,3]
Blood glucose level is considered among the factors that can influence the accuracy of SUVmax. Non-labeled endogenous blood glucose competitively inhibits 18F-FDG uptake, and hence it poses an inversely-linear effect on SUVmax.[4]
The European and American guidelines for PET/CT imaging recommended the measurement of blood glucose level prior to scanning and rescheduling the examination whenever the level exceeds 200 mg/dL.[5,6]
SUVmax of normal background tissues, including the liver and mediastinal blood pool are commonly used as references to define the disease and assess tumor response to therapy.[7] The ideal background SUV should not vary with glycemic fluctuation during the examination to minimize variability in the assessment of therapeutic response. The aim of this study was to evaluate the effect of blood glucose level and other confounding factors on the variability of SUVmax in normal tissues within the same patient in two separate occasions and to suggest an ideal reference tissue.
MATERIALS AND METHODS
Following approval of our institutional review board with waiving written consent, we retrospectively analyzed 334 18F-FDG PET/CT scans of 167 cancer patients who had undergone clinical PET/CT examinations for various oncological indications. Patients’ medical records were reviewed to collect data on age, sex, body weight, length, and blood glucose level at the time of 18F-FDG injection, administered 18F-FDG dose, and the time intervals between 18F-FDG administration and imaging on both occasions. Patients with extensive disease in any of the target organs were excluded from the analysis.
18F-FDG PET/CT protocol
Patients fasted for at least four hours before imaging with blood glucose level <180 mg /dL before intravenous administration of about 5.18 MBq/kg (0.14 mCi/kg), with a maximum dose of 444 MBq (12 mCi).
18F-FDG PET/CT image acquisition and reconstruction
Imaging was performed approximately 60 min (mean: 66 ± 19.3 min.) after 18F-FDG injection, using a high-spatial-resolution, full-ring PET scanner (Biograph mCT Flow, Siemens Healthineer, Erlangen, Germany), combining lutetium oxyorthosilicate (LSO)-based PET crystals and 20-slice CT components. An imaging field of view from the base of the skull to mid-thighs with the arms above the head whenever possible was used, or otherwise, the arms were positioned beside the body.
The CT scan was performed before the emission acquisition as a single sweep. The slice thickness was 3 mm with a pitch of 0.9 and a tube voltage of 120 kV. The tube current was automatically modulated according to the patient’s body mass index (BMI); 50–100 mAs were used to achieve good image quality. CT data were used for image fusion and the generation of the CT transmission map. No contrast was used. PET emission data were acquired in a three-dimensional model, using continuous table motion acquisition mode with an average table speed of 0.9 mm/s.
The imaging data were reconstructed using a point spread function and a time-of-flight algorithm (TrueX + time-of-flight, UltraHD-PET), with three iterations and 21 subsets, with a 200 × 200 reconstruction matrix size.
Subsequently, a Gaussian filter with a 5 mm full-width half-maximum was applied to the reconstructed images.
Low-dose CT without a contrast agent was used for attenuation and scatter correction as well as anatomical mapping. Transaxial, sagittal, coronal, and fused images were analyzed on the manufacturer’s workstation (Syngo.via, Siemens Healthineers).
18F-FDG PET/CT image analysis and semi-quantitative evaluation
Visual and semi-quantitative image analysis was retrospectively performed by two experienced nuclear medicine physicians. SUVmax was derived from a three-dimensional volume of interest (VOI) manually assigned at the site of concern using PET Volume Computerized Assisted Reporting on Syngo. via workstation (Siemens Healthineers).
Ten VOIs were placed on the brain (right cerebral hemisphere), right tonsil, blood pool (arch of the aorta), heart (left ventricle wall), right lung, right lobe of the liver, spleen, bone marrow (BM), fat and iliopsoas muscle (opposite third lumbar vertebra), away from any pathological 18F-FDG uptake or artifact that could affect the calculation of SUVmax. The same VOI was matched regarding the size and anatomical location on the two studies [Figures 1 and 2].
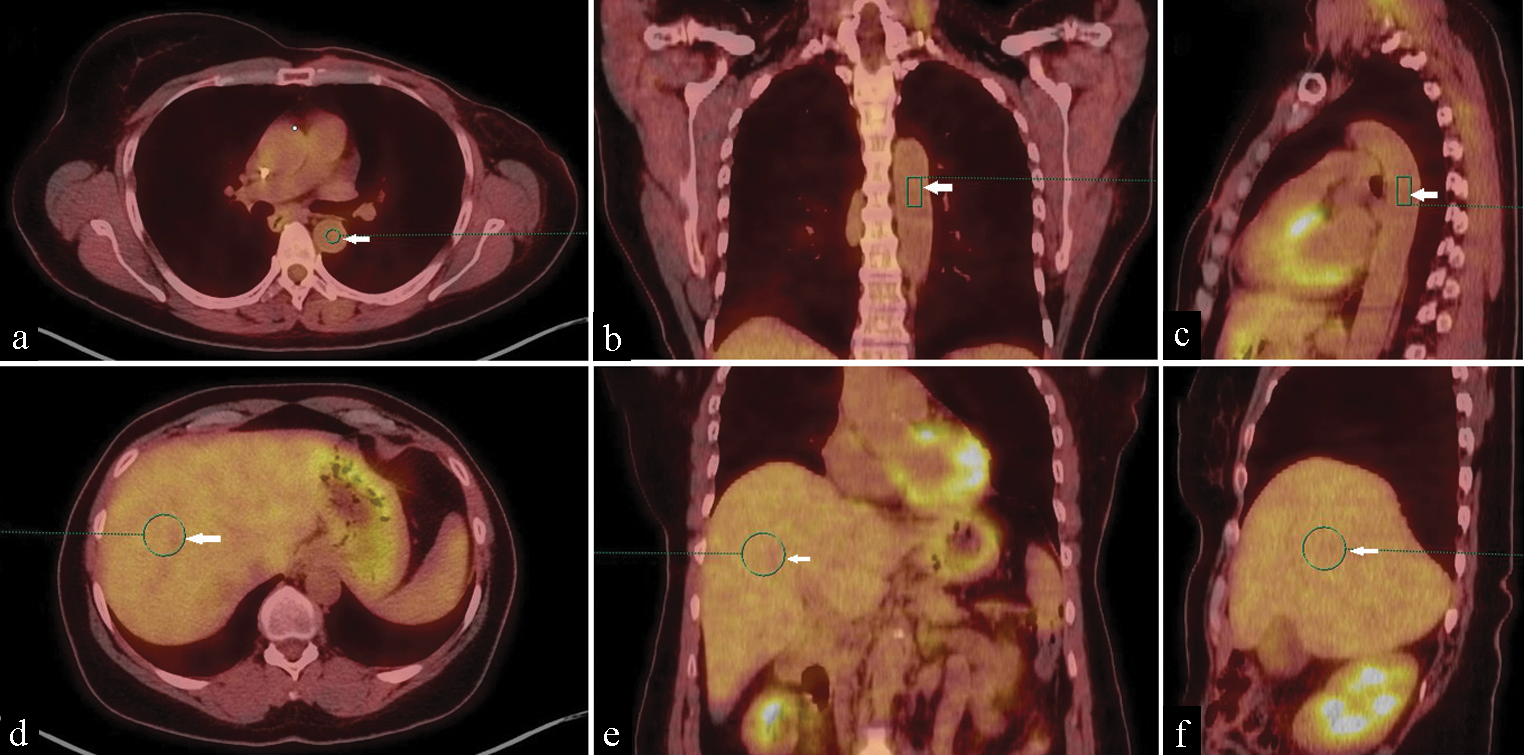
- 18F-FDG PET/CT scan of a 60-year-old female with breast cancer. (a) Transaxial coregistered PET/CT, (b) Coronal coregistered PET/CT and (c) Sagittal coregistered PET/CT images demonstrate placement of the standard three-dimensional volume of interest for mediastinal blood pool (arrowed green circle and rectangles). (d) Transaxial PET/CT fusion, (e) Coronal PET/CT fusion and (f) Sagittal PET/CT fusion images demonstrate placement of the standard three-dimensional volume of interest for liver (arrowed green circles).

- 18F-FDG PET/CT scan of a 60-year-old female with breast cancer. Transaxial coregistered PET/CT images demonstrate placement of the standard three-dimensional volume of interest for normal tissues (arrowed green circles) including lung, spleen and muscle (left column), heart, bone marrow, fat (middle column), brain and tonsil (right column).
Statistical analysis
Data were analyzed using SPSS 20.0 software (Statistical Package for the Social Sciences, IBM Inc., Armonk, New York, USA). Continuous parametric variables were expressed as the mean ± standard deviation (SD). An independent sample t-test was used to compare the means. Pearson correlation coefficient analysis was used to assess the correlation between blood glucose level and SUVmax of normal tissues, where the degree of correlation was considered negligible (0.00–<0.10), weak (0.10–0.39), moderate (0.40–0.69), strong (0.70–0.89), or very strong (0.90–1.00).[8] Paired sample t-test was used to compare differences in SUVmax between the two studies. A significant P-value was considered when it was less than 0.05.
RESULTS
One hundred sixty-seven cancer patients (95 females and 72 males), were retrospectively recruited with mean age of 47.7 ± 15 years. Thirty-eight patients (22.8%) were diabetics. About 55% of the study populations had lymphoma and 18F-FDG-PET/CT was requested for their initial staging, 31% had breast cancer, 10 % had colorectal cancer, and 4% had prostate cancer and 18F-FDG-PET/CT was requested for initial staging or follow-up on the first occasion. All patients had two studies, on average 152 ± 68 days apart.
There were no statistically significant differences between the two occasions regarding the mean body weight (74.7 ± 16.8 versus 75.1 ± 16.5 Kg; P-value: 0.43), mean BMI (27.7 ± 7.4 versus 27.8 ± 7.5 Kg/m2; P-value: 0.357) and mean blood glucose level ( 103.7 ± 27.4 versus 105.3 ± 26.2 mg/dL; P-value: 0.44), while the mean value for injected 18F-FDG activity was significantly higher on the first occasion (9.1 ± 1.8 versus 8.8 ± 1.9 mCi; P-value: 0.005), and mean uptake duration was significantly longer on the second occasion (70.9 ± 27 versus 77.9 ± 34.4 min; P-value: 0.019 ).
There were statistically significant differences between diabetics and nondiabetics regarding the mean BMI on both occasions (29.7 ± 5.2 versus 27.2 ± 7.8 Kg/m2; P-value: 0.004 on the first occasion and 29.9 ± 5.4 versus 27.3 ± 7.9 Kg/m2; P-value: 0.003 on the second occasion), mean blood glucose level (130.9 ± 32.5 versus 95.8 ± 19.7 mg/dL; P-value: <0.01 on first occasion and 131.3 ± 34.9 versus 97.8 ± 16.8 mg/dL; P-value: <0.01 on the second occasion) and mean value for injected 18F-FDG activity on the first occasion only (9.7 ± 1.4 versus 8.6 ± 1.9 mCi; P-value: 0.021). While, there was no statistically significant difference between diabetics and nondiabetics regarding the mean value for injected 18F-FDG activity on the second occasion only (9.3 ± 1.7 versus 8.7 ± 1.9 mCi; P-value: 0.113), as well as the mean uptake duration on both occasions (64.6 ± 17.8 versus 72.7 ± 29.1 min.; P-value: 0.218 on the first occasion and 74.5 ± 24.6 versus 78.9 ± 36.9 min.; P-value: 0.874 on the second occasion). The differences in BMI, blood glucose level, injected dose of 18F-FDG and 18F-FDG uptake duration between diabetic and non-diabetic are illustrated in [Table 1].
| First study | Second study | |||||||
|---|---|---|---|---|---|---|---|---|
| All | Diabetic | Non-diabetics | All | Diabetic | Non-diabetics | |||
| Variable | (mean α SD) | (mean α SD) | (mean α SD) | P-value | (mean α SD) | (mean α SD) | (mean α SD) | P-value |
| BMI (Kg/m2) | 27.7 ± 7.4 | 29.7 ± 5.2 | 27.2 ± 7.8 | 0.004 | 27.8 ± 7.5 | 29.9 ± 5.4 | 27.3 ± 7.9 | 0.003 |
| 18F-FDG dose (mCi) | 9.1 ± 1.8 | 9.7 ± 1.4 | 8.6 ± 1.9 | 0.021 | 8.8 ± 1.9 | 9.3 ± 1.7 | 8.7 ± 1.9 | 0.113 |
| Blood glucose level (mg/dL) | 103.8 ± 24 | 130.9 ± 32.5 | 95.8 ± 19.7 | <0.01 | 105.3 ± 26.2 | 131.3 ± 34.9 | 97.8 ± 16.8 | <0.01 |
| Time to imaging (min.) | 70.9 ± 27 | 64.6 ± 17.8 | 72.7 ± 29.1 | 0.218 | 77.9 ± 34.4 | 74.5 ± 24.6 | 78.9 ± 36.9 | 0.874 |
SUVmax of the lung and the heart were significantly different in the two studies (0.67 ± 0.29 versus 0.75 ± 0.37; P-value = 0.003 and 6.6 ± 5.6 versus 7.7 ± 5.7; P = 0.024, respectively); while that of other normal tissues showed insignificant difference between the two studies.
Blood glucose level
The SUVmax of brain showed significant week negative correlation with the blood glucose level in both studies (r = −0.245, P-value = <0.001 versus r = −0.232, P-value = 0.003, respectively). The SUVmax of tonsils showed negligible negative correlation with the level of blood glucose in both studies, and the heart showed negligible negative correlation with the level of blood glucose in the second study only. The SUVmax of other normal tissues showed a negligible or weak positive correlation with the blood glucose level in both studies.
On subgroup analysis, the brain uptake showed a significant moderate negative correlation with the level of blood glucose in diabetic patients (r = −0.537, P-value = 0.001) in the first study only, while the SUVmax of other tissues showed negligible or weak correlation with the level of blood glucose in both studies [Table 2].
| Level of blood glucose in first study | Level of blood glucose in second study | ||||||||||||
|---|---|---|---|---|---|---|---|---|---|---|---|---|---|
| All patients | Diabetics | Non-diabetics | All patients | Diabetics | Non-diabetics | ||||||||
| Parameter | r | P-value | r | P-value | r | P-value | r | P-value | r | P-value | r | P-value | |
| Liver SUVmax | 0.318 | <0.001 | 0.393 | 0.015 | 0.267 | 0.002 | 0.318 | <0.001 | 0.070 | 0.676 | 0.225 | 0.009 | |
| Spleen SUVmax | 0.279 | <0.001 | 0.103 | 0.540 | 0.209 | 0.015 | 0.239 | 0.002 | 0.096 | 0.566 | 0.189 | 0.028 | |
| Lung SUVmax | 0.215 | 0.005 | 0.029 | 0.862 | 0.152 | 0.078 | 0.088 | 0.257 | −0.136 | 0.417 | 0.051 | 0.556 | |
| Brain SUVmax | −0.245 | <0.001 | −0.537 | 0.001 | −0.192 | 0.026 | −0.232 | 0.003 | −0.314 | 0.055 | −0.118 | 0.174 | |
| Muscle SUVmax | 0.202 | 0.009 | 0.366 | 0.024 | 0.012 | 0.886 | 0.190 | 0.014 | 0.023 | 0.892 | 0.230 | 0.007 | |
| Blood pool SUVmax | 0.340 | <0.001 | 0.356 | 0.028 | 0.190 | 0.027 | 0.235 | 0.002 | 0.135 | 0.420 | 0.108 | 0.211 | |
| Tonsil SUVmax | −0.007 | 0.929 | −0.104 | 0.533 | 0.022 | 0.796 | −0.070 | 0.369 | −0.199 | 0.230 | −0.086 | 0.323 | |
| Heart SUVmax | 0.081 | 0.298 | −0.115 | 0.492 | 0.076 | 0.379 | −0.020 | 0.799 | 0.058 | 0.729 | 0.044 | 0.613 | |
| BM SUVmax | 0.004 | 0.963 | 0.059 | 0.725 | −0.086 | 0.323 | 0.085 | 0.275 | 0.217 | 0.192 | 0.037 | 0.668 | |
| Fat SUVmax | 0.181 | 0.019 | 0.094 | 0.575 | 0.091 | 0.294 | 0.186 | 0.016 | 0.181 | 0.276 | 0.041 | 0.637 | |
r, Correlation Coefficient; (significant moderate correlations at P < 0.05 are marked in bold)
BMI
The SUVmax of liver showed significant moderate positive correlation with BMI in both studies (r = 0.416, P-value = <0.001 versus r = 0.453, P-value = <0.001, respectively), and blood pool activity showed significant moderate positive correlation with BMI in the first study only (r = 0.414, P-value = <0.001). Other normal tissues showed either week or negligible positive correlation in both studies, except for the heart which showed negligible negative correlation with BMI in the second study only.
On subgroup analysis, the SUVmax of liver showed significant moderate positive correlation with BMI in non-diabetic patients in both studies (r = 0.482, P-value = <0.001 and r = 0.474, P-value = <0.001, respectively), the SUVmax of spleen showed significant moderate positive correlation with BMI in diabetic patients in the second study (r = 0.464, P-value = 0.003), and blood pool activity showed significant moderate positive correlation with BMI in non-diabetic patients on the first study only (r = 0.421, P-value = <0.001). The SUVmax of other normal tissues showed week or negligible correlation with BMI [Table 3].
| BMI in first study | BMI in second study | |||||||||||
|---|---|---|---|---|---|---|---|---|---|---|---|---|
| All patients | Diabetics | Non-diabetics | All patients | Diabetics | Non-diabetics | |||||||
| Parameter | r | P-value | r | P-value | r | P-value | r | P-value | r | P-value | r | P-value |
| Liver SUVmax | 0.416 | <0.001 | 0.050 | 0.764 | 0.482 | <0.001 | 0.453 | <0.001 | 0.339 | 0.037 | 0.474 | <0.001 |
| Spleen SUVmax | 0.303 | <0.001 | 0.158 | 0.345 | 0.337 | <0.001 | 0.397 | <0.001 | 0.464 | 0.003 | 0.357 | <0.001 |
| Lung SUVmax | 0.353 | <0.001 | 0.385 | 0.017 | 0.348 | <0.001 | 0.251 | 0.001 | 0.250 | 0.130 | 0.259 | 0.003 |
| Brain SUVmax | 0.199 | 0.010 | 0.260 | 0.115 | 0.251 | 0.004 | 0.171 | 0.027 | 0.125 | 0.456 | 0.244 | 0.005 |
| Muscle SUVmax | 0.206 | 0.008 | 0.293 | 0.074 | 0.202 | 0.022 | 0.227 | 0.003 | 0.189 | 0.256 | 0.220 | 0.012 |
| Blood pool SUVmax | 0.414 | <0.001 | 0.312 | 0.057 | 0.421 | <0.001 | 0.216 | 0.005 | 0.540 | <0.001 | 0.193 | 0.029 |
| Tonsil SUVmax | 0.153 | 0.049 | 0.073 | 0.664 | 0.182 | 0.039 | 0.136 | 0.081 | 0.184 | 0.268 | 0.169 | 0.056 |
| Heart SUVmax | 0.060 | 0.441 | −0.006 | 0.971 | 0.079 | 0.375 | −0.014 | 0.857 | −0.043 | 0.797 | −0.006 | 0.948 |
| BM SUVmax | 0.223 | 0.004 | 0.229 | 0.168 | 0.243 | 0.006 | 0.203 | 0.009 | 0.356 | 0.028 | 0.178 | 0.044 |
| Fat SUVmax | 0.095 | 0.224 | 0.274 | 0.096 | 0.046 | 0.605 | 0.086 | 0.271 | 0.136 | 0.414 | 0.060 | 0.497 |
r, Correlation Coefficient; (significant moderate correlations at P < 0.05 are marked in bold)
18F-FDG uptake time
The liver and blood pool activities showed significant moderate negative correlation with 18F-FDG uptake time in first study only (r = −0.405, P-value = <0.001; and r = −0.409, P-value = <0.001, respectively). The spleen, brain, lung, muscle, and fat show negligible to weak negative correlation with 18F-FDG uptake time in both studies, while tonsil, heart, and BM showed negligible to week positive correlation.
On subgroup analysis, the SUVmax of liver showed significant moderate negative correlation with 18F-FDG uptake time in non-diabetic patients in the first study (r = −0.426, P-value = <0.001 and significant moderate negative correlation in diabetic patients in the second study (r = −0.535, P-value = 0.030), and blood pool activity showed significant moderate negative correlation with 18F-FDG uptake time in diabetic patients in both studies (r = −0.574, P-value = <0.001 and r = −0.433, P-value = 0.007, respectively). The SUVmax of other normal tissues showed week or negligible correlation with 18F-FDG uptake time in both diabetics and non-diabetics [Table 4].
| 18F-FDG Uptake time in first study | 18F-FDG Uptake time in second study | |||||||||||
|---|---|---|---|---|---|---|---|---|---|---|---|---|
| All patients | Diabetics | Non-diabetics | All patients | Diabetics | Non-diabetics | |||||||
| Parameter | r | P-value | r | P-value | r | P-value | r | P-value | r | P-value | r | P-value |
| Liver SUVmax | −0.405 | <0.001 | −0.274 | 0.096 | −0.426 | <0.001 | −0.364 | <0.001 | −0.535 | 0.030 | −0.371 | <0.001 |
| Spleen SUVmax | −0.179 | 0.020 | −0.049 | 0.770 | −0.203 | 0.021 | −0.323 | <0.001 | −0.160 | 0.337 | −0.358 | <0.001 |
| Lung SUVmax | −0.093 | 0.233 | −0.198 | 0.233 | −0.061 | 0.495 | −0.112 | 0.148 | −0.326 | 0.046 | −0.056 | 0.527 |
| Brain SUVmax | −0.057 | 0.464 | −0.085 | 0.610 | −0.099 | 0.264 | −0.082 | 0.293 | 0.023 | 0.893 | −0.125 | 0.158 |
| Muscle SUVmax | −0.088 | 0.257 | −0.112 | 0.503 | −0.091 | 0.303 | −0.166 | 0.032 | −0.088 | 0.600 | −0.191 | 0.030 |
| Blood pool SUVmax | −0.409 | <0.001 | −0.574 | <0.001 | −0.374 | <0.001 | −0.247 | 0.001 | −0.433 | 0.007 | −0.233 | 0.008 |
| Tonsil SUVmax | 0.091 | 0.241 | −0.157 | 0.346 | 0.105 | 0.234 | 0.098 | 0.206 | 0.205 | 0.217 | 0.078 | 0.380 |
| Heart SUVmax | 0.001 | 0.990 | 0.011 | 0.949 | −0.003 | 0.971 | 0.061 | 0.435 | 0.133 | 0.424 | 0.046 | 0.604 |
| BM SUVmax | 0.118 | 0.128 | 0.135 | 0.420 | 0.107 | 0.227 | 0.005 | 0.944 | −0.050 | 0.764 | 0.016 | 0.860 |
| Fat SUVmax | −0.138 | 0.076 | −0.149 | 0.372 | −0.125 | 0.158 | −0.142 | 0.067 | −0.208 | 0.211 | −0.127 | 0.153 |
r, Correlation Coefficient; (significant moderate correlations at P < 0.05 are marked in bold)
Multivariate analysis
In the multivariate analysis adjusted for age, sex, BMI, and injected dose, the liver showed a consistent effect of the injected 18F-FDG dose and uptake duration on its SUVmax on the two occasions. In comparison, spleen and muscle showed consistent effect only of the injected dose on the two occasions. Other organs showed variable results on either occasion. None of the above factors had a significant effect on SUVmax in the heart. Associations of blood glucose level with SUVmax remained significant for the brain cortex in both studies and for the tonsils in the second study only. The injected dose consistently had a significant effect on SUVmax in the liver, spleen, and muscles on the two occasions and on the SUVmax of the brain, blood pool, and BM on the first occasion and in tonsils on the second occasion only.
Patients’ age had a significant effect on SUVmax of fat on the first occasion and on the SUVmax of BM on the second occasion only.
The patient’s gender had consistently a significant effect on SUVmax in the brain on the two occasions and on the SUVmax of tonsils and lungs on the first occasion only.
BMI had consistently a significant effect on SUVmax in the lung on the two occasions and on the SUVmax of the blood pool, and BM on the first occasion and in tonsils on the second occasion only.
Uptake duration had consistently a significant effect on SUVmax in the liver on the two occasions, and on the SUVmax of blood pool and BM on the first occasion only [Tables 5 and 6].
| Variable | Brain | Tonsil | Blood pool | Heart | Lung | Liver | Spleen | BM | Muscle | Fat | |
|---|---|---|---|---|---|---|---|---|---|---|---|
| Age | β | 0.188 | |||||||||
| 95% CI | 0.000–0.004 | ||||||||||
| P | 0.031 | ||||||||||
| Sex | β | 0.206 | 0.257 | 0.205 | |||||||
| 95% CI | 0.398–2.019 | 0.293–1.150 | 0.034–0.208 | ||||||||
| P | 0.004 | 0.001 | 0.007 | ||||||||
| BMI | β | 0.174 | 0.318 | 0.196 | |||||||
| 95% CI | 0.001–0.024 | 0.005–0.020 | 0.001–0.040 | ||||||||
| P | 0.034 | 0.001 | 0.039 | ||||||||
| Blood glucose level | β | −0.430 | |||||||||
| 95% CI | −0.061:−0.030 | ||||||||||
| P | <0.001 | ||||||||||
| Injected dose in mci | β | 0.289 | 0.247 | 0.276 | 0.230 | 0.247 | 0.046 | ||||
| 95% CI | 0.172–0.757 | 0.022–0.123 | 0.043–0.182 | 0.010–0.129 | 0.020–0.189 | 0.006–0.086 | |||||
| P | 0.002 | 0.005 | 0.002 | 0.022 | 0.015 | 0.024 | |||||
| Uptake duration | β | −0.243 | −0.228 | 0.221 | |||||||
| 95% CI | −0.008:−0.002 | −0.01:−0.002 | 0.002–0.011 | ||||||||
| P | 0.001 | 0.001 | 0.007 |
β, standardized regression coefficient
| Variable | Brain | Tonsil | Blood pool | Heart | Lung | Liver | Spleen | BM | Muscle | Fat | |
|---|---|---|---|---|---|---|---|---|---|---|---|
| Age | β | −0.274 | |||||||||
| 95% CI | −0.022: −0.005 | ||||||||||
| P | 0.002 | ||||||||||
| Sex | β | 0.177 | |||||||||
| 95% CI | 0.138–1.816 | ||||||||||
| P | 0.023 | ||||||||||
| BMI | β | 0.341 | 0.222 | ||||||||
| 95% CI | 0.029 – 0.124 | 0.000–0.022 | |||||||||
| P | 0.002 | 0.042 | |||||||||
| Blood glucose level | β | −0.309 | −0.174 | ||||||||
| 95% CI | −0.049:−0.016 | −0.022:−0.001 | |||||||||
| P | <0.001 | 0.038 | |||||||||
| Injected dose in mci | β | −0.239 | 0.387 | 0.413 | 0.285 | ||||||
| 95% CI | −0.401:−0.018 | 0.075–0.212 | 0.065–0.181 | 0.011–0.083 | |||||||
| P | 0.032 | <0.001 | <0.001 | 0.010 | |||||||
| Uptake duration | β | −0.150 | |||||||||
| 95%CI | −0.006:0.000 | ||||||||||
| P | 0.034 |
β, standardized regression coefficient
DISCUSSION
The measurement of SUV is frequently used either to categorize a lesion as benign or malignant or to monitor cancer with 18F-FDG PET scanning; however, the accuracy of SUV measurement can be affected by many factors, including patient weight, blood glucose level, length of uptake period, type of VOI and partial-volume effect.[9]
Several studies had investigated the effect of hyperglycemia on the uptake of 18F-FDG in normal tissues as well as in neoplastic lesions.[3,10,11]
Brain
It is well known that high blood glucose levels reduces 18F-FDG uptake in the brain. On multivariate regression analysis in the current study, the negative association between the blood glucose levels and SUVmax remained significant after controlling for possible confounding factors, such as age, sex, BMI, injected dose of 18F-FDG, and uptake duration on the two occasions. This was concordant with the results of Viglianti et al.[10] and Sarikaya et al.[12] and could be explained by the competition of 18F-FDG and glucose on the membrane glucose transporters (GLUTs) in the blood-brain barrier.[13,14]
On subgroup analysis, the effect of blood glucose level on tracer uptake in the brain was stronger in diabetic than in non-diabetic patients (r = −0.537, P-value = 0.001 on the first occasion and r = −0.314, P-value = 0.055 on the second occasion in diabetic patients compared to r = −0.192, P-value = 0.026 and r = −0.118, P-value = 0.174 in non-diabetic patients, respectively). This was concordant with the results of Büsing et al.[15] who reported comparable values for the correlation coefficient between brain SUVmax and blood glucose level (r = −0.449, P-value = 0.110 in diabetic patients compared to r = −0.235, P-value = 0.082 in non-diabetic patients). The only difference is that they did not get a statistically significant correlation in their study, probably because of their smaller sample size compared to ours. Sarikaya et al.[12] found that blood glucose levels higher than 110 mg/dL gradually reduce brain 18F-FDG uptake, this also considered consistent with our results as in the current study; diabetics tend to have higher blood glucose levels than non-diabetic patients.
Liver
Similar to previous literature, we found that the SUVmax of the liver show only week positive correlation with blood glucose level on the two occasions,[10,16,17] whereas other authors reported no significant association.[15,18,19]
The liver uptake showed a significant moderate positive correlation with BMI on both occasions. In agreement with our results, Malladiet al.[16], Kamimura et al.[20] and Mahmud et al.[18] reported that BMI had the strongest association with liver 18F-FDG uptake. As patients with higher BMI have more fatty tissues in their bodies, which have a relatively low glucose uptake in the fasting state, a higher proportion of the injected 18F-FDG remains available for uptake by other organs, including the liver.[21,22] In contrast, Büsing et al. reported that high BMI was found to decrease the mean SUVmax in various healthy organs, including the liver.[15] Moreover, on subgroup analysis, the liver showed a significant moderate positive correlation with BMI in non-diabetic patients only on both occasions. This is likely due to higher blood glucose among diabetic patients in our cohort which compete for 18F-FDG uptake and attenuate the association between BMI and 18F-FDG uptake in diabetic patients.[19]
The liver uptake showed a significant moderate negative correlation with 18F-FDG uptake time on the first occasion and a significant week negative correlation on the second occasion, which is greater than the partial negative correlation between 18F-FDG uptake time and liver uptake reported by Malladi et al.[16]. Also, Chirindel et al. reported a mild time-dependent reduction of liver 18F-FDG uptake at dual-phase 18F-FDG PET/CT.[23] On the other hand, Chin et al. reported that normal liver showed only slightly elevated 18F-FDG uptake at delayed compared to early images.[24]
In multivariate analysis, only the injected doses of 18F-FDG and the 18F-FDG uptake duration maintained a significant association with liver SUVmax on both occasions; in contrast to ours Sprinz et al. found that blood glucose level remained significantly correlated with SUVmax after adjustment for other confounding variables.[3] Malladi et al. reported that BMI had the strongest association and maintained significant moderate correlation with liver 18F-FDG uptake (r = 0.43; P <0.001) after adjusting for other significant confounding variables.[16]
Mediastinal blood pool
The blood pool activities showed a significant moderate positive correlation with BMI in the first study only, which was maintained in non-diabetic patients on subgroup analysis. Chiaravalloti et al. reported a slight relationship between weight and mediastinum SUV in few occasions on repeated measurements.[25] In contrast, Kuruva et al. found that mediastinal SUVs were not significantly affected by body weight when normalized to body weight, body surface area or lean body mass.[26]
The blood pool activities showed a significant moderate negative correlation with 18F-FDG uptake time in diabetic patients in both studies and in the whole cohort of patients in the first study only. Also, Chin et al. reported that the mean blood pool was modestly lower on delayed images.[24] In contrast, Malladi et al. reported that the uptake time was significantly associated with mediastinal blood pool SUV in univariate analysis.[16]
Multivariate regression analysis showed inconsistent results on the two occasions, and none of the studied factors showed significant association with blood pool activity on the second occasion; this comes in line with the results of Kuruva et al.[26] Thus, the effect of blood glucose level on the mediastinal blood pool appears to be negligible, and this might be explained by the fact that GLUT-1 is the main expressed GLUT in the red blood cell membrane, which is insulin-independent; hence, insulin resistance would not affect blood pool 18F-FDG activity.[27]
Muscle
In the current study, we found only a significant week positive correlation between blood glucose level and muscle 18F-FDG uptake, which is more pronounced in diabetic patients on the first occasion. In agreement with our findings, Büsing et al. reported a significant positive correlation between blood glucose level and muscle 18F-FDG uptake.[15] On the other hand, Eskian et al. reported a significant negative relationship between blood glucose level and SUVmax of muscle.[4] This might be explained by the fact that GLUT4 in skeletal muscle is one of the insulin-dependent GLUTs, which may facilitate glucose and 18F-FDG cell uptake in patients with high insulin levels, and may result in diminishing glucose and 18F-FDG cell uptake in insulin resistance status.[28,29]
Though muscle metabolism was previously reported to be age- and sex-dependent,[30,31] the multivariate regression analysis in the current study showed that only the association between the injected dose of 18F-FDG and muscular SUVmax remained significant after controlling for other confounding factors in the two occasions.
Spleen
Similar to Büsing et al.,[15] we found that SUVmax of the spleen uptake showed a weak positive correlation with blood glucose level and BMI on the two occasions, with a significant moderate positive correlation with BMI in diabetic patients in the second study only. Viglianti et al. reported that blood glucose and BMI had no significant influence on spleen uptake. In the current study, the spleen uptake showed a weak negative correlation with 18F-FDG uptake time on the two occasions.[10] In contrast, Chin et al. reported that the spleen showed only slightly elevated 18F-FDG uptake at delayed imaging.[24]
On multivariate regression analysis, we found that the association between the injected dose of 18F-FDG and spleen SUVmax remained significant after controlling for other confounding factors on the two occasions.
Heart
In our study and a similar study, neither the blood glucose level nor any of the confounding factors had a significant effect on the metabolic activity of the heart; additionally, we found that the SUVmax of the heart was significantly different between the two studies.[1] This may be explained by the fact that the normal myocardial metabolism utilizes glucose and lactate of no more than 30%, in addition to various substrates including fatty acids, carbohydrates, amino acids, and lactate. Thus, multiple other factors besides blood glucose and insulin could interfere with myocardial metabolism and may therefore lower the effect of serum glucose level and insulin on myocardial uptake of 18F-FDG.[15]
Other normal tissues
The metabolic activity of other normal tissues showed a weak or negligible correlation with blood glucose level, BMI and 18F-FDG uptake time. On multivariate analysis, there was an inconsistent association with the confounding factors on either occasion and blood glucose level did not have a significant effect on their SUVmax as concordant with previous studies.[1,3] Additionally, in line with Paquet et al., we found that lung SUVmax was significantly different between the two occasions.[2]
The ideal reference tissue should have satisfactory test/retest stability for a given patient to minimize variability in the assessment of therapeutic response.[10] The liver is the only reference region that so far has been studied and used extensively to eliminate or reduce the effect of various factors such as body weight, obesity, the blood glucose level, and 18F-FDG uptake time on SUVmax;[32] as the liver does not irreversibly trap the 18F-FDG and maintains a roughly constant SUV level during the 18F-FDG PET/CT imaging time window.[33-38] However, liver SUV has been reported to show an intra-individual variability during courses of aggressive chemotherapy of some neoplasms and steroid therapy for sarcoidosis.[25,39] Furthermore, it has been reported that normal hepatic 18F-FDG uptake was quite variable in delayed PET images, as the liver is the major glucose regulating organ through gluconeogenesis and glycogen storage.[24,40]
Several studies suggested that the blood pool is a more optimal and stable reference tissue than the liver,[1,3,25,39,41] as it is much less dependent than the liver on glycemia and other variables.[10] However, in the current study though the blood pool activity was a stable parameter, it showed inconsistent association with blood glucose level, and other confounding factors on the two occasions. As the measurement of the blood pool is difficult and involves drawing of VOIs at multiple levels of the aorta, other tissues must be considered as background organs.
Among the studied normal tissues in the current study, liver, muscle, and splenic activities showed satisfactory test/retest stability and their measurement is much easier. Also, their metabolic activities are much less dependent than the blood pool activity on glycemia and other variables and can be used as reference organs. The spleen and muscle appear to be more optimal reference than the liver, as its metabolic activity is only associated with the injected dose of 18F-FDG compared to the liver which was found to be associated with the injected dose and uptake duration of 18F-FDG on multivariate analysis.
A unique feature of this study compared to previous similar studies concerned with the effect of blood sugar on the uptake within normal tissues, was the measurement of the effect of blood glucose and other confounding factors on 18F-FDG uptake in normal tissues in two occasions at the same cohort of patients.
Limitations of the study
Its retrospective nature and measurement of SUVmax only according to body weight and do not take into consideration other methods for SUV measurement. A further larger prospective study is needed to verify the impact of high blood glucose levels and other confounding factors on 18F-FDG uptake and utilize other methods of SUV calculation. Although SUVmax is the most common and most reproducible metabolic parameter used, less susceptible to interobserver variability and independent of ROI size; it only represents the maximum value of a single voxel in the tumor and is more susceptible to image noise.[42] SUVmean is less sensitive to image noise than SUVmax but more sensitive to ROI definition, subject to intra- and interobserver variability.[43] SUVpeak which is the mean value of radiotracer uptake within the ROI surrounding the pixel with the highest activity combines reproducibility of SUVmax and image noise reduction of SUVmean. However, it has reduced accuracy in the evaluation of small lesions, compared with SUVmax.[44,45]
As SUVmax of normal tissues except for lung and heart showed insignificant difference between the two studies, we assumed that the disease burden probably has no effect on the uptake within the normal tissues and we did not include it in our analysis which is another potential limitation of the current study. A further larger prospective study is needed to verify the potential effect of disease burden and metabolic activity of the largest and most hypermetabolic lesion on uptake within normal tissues.
CONCLUSION
Among the normal tissues in the current study, liver, muscle, and splenic activities showed satisfactory test/retest stability and can be used as reference activities. The splenic and muscle uptake appear to be more optimal reference than the liver, as it is only associated with the injected dose of 18F-FDG compared to the liver which is found to be associated with the injected dose and uptake duration of 18F-FDG, and can be considered as background organs in future guidelines.
Declaration of patient consent
Institutional Review Board permission was obtained for the study.
Financial support and sponsorship
Nil.
Conflicts of interest
There are no conflicts of interest.
References
- Effects of blood glucose level on 18F-FDG uptake for PET/CT in normal organs: A systematic review. PLoS One. 2018;13:e0193140.
- [CrossRef] [PubMed] [Google Scholar]
- Within-patient variability of 18F-FDG: Standardized uptake values in normal tissues. J Nucl Med. 2004;45:784-8.
- [PubMed] [Google Scholar]
- Effects of blood glucose level on 18F fluorodeoxyglucose (18F-FDG) uptake for PET/CT in normal organs: An analysis on 5623 patients. Sci Rep. 2018;8:1-6.
- [CrossRef] [PubMed] [Google Scholar]
- Effect of blood glucose level on standardized uptake value (SUV) in 18F-FDG PET-scan: A systematic review and meta-analysis of 20,807 individual SUV measurements. Eur J Nucl Med Mol Imaging. 2019;46:224-7.
- [CrossRef] [PubMed] [Google Scholar]
- Procedure guideline for tumor imaging with 18F-FDG PET/CT 1.0. J Nucl Med. 2006;47:885-95.
- [PubMed] [Google Scholar]
- FDG PET/CT: EANM procedure guidelines for tumour imaging: version 2.0. Eur J Nucl Med Mol Imaging. 2015;42:328-54.
- [CrossRef] [PubMed] [Google Scholar]
- From RECIST to PERCIST: Evolving considerations for PET response criteria in solid tumors. J Nucl Med. 2009;50:122S-50S.
- [CrossRef] [PubMed] [Google Scholar]
- Correlation coefficients: Appropriate use and interpretation. Anesth Analg. 2018;126:1763-68.
- [CrossRef] [PubMed] [Google Scholar]
- A threshold method to improve standardized uptake value reproducibility. Nucl Med Commun. 2000;21:685-90.
- [CrossRef] [PubMed] [Google Scholar]
- Effect of hyperglycemia on brain and liver 18F-FDG standardized uptake value (FDG SUV) measured by quantitative positron emission tomography (PET) imaging. Biomed Pharmacother. 2017;88:1038-45.
- [CrossRef] [PubMed] [Google Scholar]
- Quantification of tumour 18 F-FDG uptake: Normalise to blood glucose or scale to liver uptake? Eur Radiol. 2015;25:2701-08.
- [CrossRef] [PubMed] [Google Scholar]
- Assessing the effect of various blood glucose levels on 18F-FDG activity in the brain, liver, and blood pool. J Nucl Med technology. 2019;47:313-18.
- [CrossRef] [PubMed] [Google Scholar]
- Influence of blood glucose on the expression of glucose transporter proteins 1 and 3 in the brain of diabetic rats. Chin Med J (Engl). 2007;120:1704-09.
- [PubMed] [Google Scholar]
- Glucose transporter proteins in brain: Delivery of glucose to neurons and glia. Glia. 1997;21:2-21.
- [CrossRef] [PubMed] [Google Scholar]
- Impact of blood glucose, diabetes, insulin, and obesity on standardized uptake values in tumors and healthy organs on 18F-FDG PET/CT. Nucl Med Biol. 2013;40:206-13.
- [CrossRef] [PubMed] [Google Scholar]
- PET/CT mediastinal and liver FDG uptake: Effects of biological and procedural factors. J Med Imaging Radiat Oncol. 2013;57:169-5.
- [CrossRef] [PubMed] [Google Scholar]
- Variation of liver SUV on 18FDG-PET/CT studies in women with breast cancer. Clin Nucl Med. 2013;38:422-5.
- [CrossRef] [PubMed] [Google Scholar]
- Impacts of biological and procedural factors on semiquantification uptake value of liver in fluorine-18 fluorodeoxyglucose positron emission tomography/computed tomography imaging. Quant Imaging Med Surg. 2015;5:700-7.
- [CrossRef] [PubMed] [Google Scholar]
- The relation between the blood glucose level and the FDG uptake of tissues at normal PET examinations. EJNMMI Res. 2013;3:1-5.
- [CrossRef] [PubMed] [Google Scholar]
- Associations between liver 18 F fluoro-2-deoxy-D-glucose accumulation and various clinical parameters in a Japanese population: Influence of the metabolic syndrome. Ann Nucl Med. 2010;24:157-61.
- [CrossRef] [PubMed] [Google Scholar]
- Adipose tissue as an endocrine organ. J Clin Endocrinol Metab. 2004;89:2548-56.
- [CrossRef] [PubMed] [Google Scholar]
- Effect of fatty acids on glucose production and utilization in man. J Clin Investig. 1983;72:1737-47.
- [CrossRef] [PubMed] [Google Scholar]
- Liver SULmean at FDG PET/CT: Effect of FDG uptake time. Clin Nucl Med. 2015;40:e17-2.
- [CrossRef] [PubMed] [Google Scholar]
- Increasing uptake time in FDG-PET: Standardized uptake values in normal tissues at 1 versus 3 h. Mol Imaging Biol. 2009;11:118-22.
- [CrossRef] [PubMed] [Google Scholar]
- Factors affecting intrapatient liver and mediastinal blood pool 18 F-FDG standardized uptake value changes during ABVD chemotherapy in Hodgkin’s lymphoma. Eur J Nucl Med Mol Imaging. 2014;41:1123-32.
- [CrossRef] [PubMed] [Google Scholar]
- Multivariate analysis of various factors affecting background liver and mediastinal standardized uptake values. Indian J Nucl Med. 2012;27:20-3.
- [CrossRef] [PubMed] [Google Scholar]
- The extended GLUT-family of sugar/polyol transport facilitators: Nomenclature, sequence characteristics, and potential function of its novel members (review) Mol Membr Biol. 2001;18:247-6.
- [CrossRef] [PubMed] [Google Scholar]
- Minireview: Recent developments in the regulation of glucose transporter-4 traffic: New signals, locations, and partners. Endocrinology. 2005;146:5071-78.
- [CrossRef] [PubMed] [Google Scholar]
- The glucose transporter family: Structure, function and tissue-specific expression. Biochem J. 1993;295:329-41.
- [CrossRef] [PubMed] [Google Scholar]
- Sex-based differences in skeletal muscle kinetics and fiber-type composition. Physiology. 2015;30:30-9.
- [CrossRef] [PubMed] [Google Scholar]
- Understanding age-related changes in skeletal muscle metabolism: Differences between females and males. Annu Rev Nutr. 2016;36:129-56.
- [CrossRef] [PubMed] [Google Scholar]
- A systematic review of the factors affecting accuracy of SUV measurements. Am J Roentgenol. 2010;195:310-20.
- [CrossRef] [PubMed] [Google Scholar]
- F-18 fluorodeoxyglucose PET in vivo evaluation of pancreatic glucose metabolism for detection of pancreatic cancer. Radiology. 1994;192:79-86.
- [CrossRef] [PubMed] [Google Scholar]
- Evaluation of benign vs malignant hepatic lesions with positron emission tomography. Arch Surg. 1998;133:510-6.
- [CrossRef] [PubMed] [Google Scholar]
- Positron emission tomography for assessment of the response to induction radiochemotherapy in locally advanced oesophageal cancer. Ann Oncol. 2002;13:361-8.
- [CrossRef] [PubMed] [Google Scholar]
- Positron emission tomography for predicting recurrence in stage I lung adenocarcinoma: Standardized uptake value corrected by mean liver standardized uptake value. Eur J Cardiothorac Surg. 2011;40:1165-9.
- [CrossRef] [PubMed] [Google Scholar]
- What parameters from 18 F-FDG PET/CT are useful in evaluation of adrenal lesions? Eur J Nucl Med Mol Imaging. 2014;41:2273-80.
- [CrossRef] [PubMed] [Google Scholar]
- Metabolic activity measured by FDG PET predicts pathological response in locally advanced superior sulcus NSCLC. Lung Cancer. 2014;85:205-12.
- [CrossRef] [PubMed] [Google Scholar]
- Which is the proper reference tissue for measuring the change in FDG PET metabolic volume of cardiac sarcoidosis before and after steroid therapy? EJNMMI Res. 2018;8:1-8.
- [CrossRef] [PubMed] [Google Scholar]
- Effects of blood glucose level on FDG uptake by liver: A FDG-PET/CT study. Nucl Med Biol. 2011;38:347-51.
- [CrossRef] [PubMed] [Google Scholar]
- Reference range for intrapatient variability in blood-pool and liver SUV for 18F-FDG PET. J Nucl Med. 2013;54:677-82.
- [CrossRef] [PubMed] [Google Scholar]
- SUV and segmentation: Pressing challenges in tumour assessment and treatment. Eur J Nucl Med Mol Imaging. 2009;36:715-20.
- [CrossRef] [PubMed] [Google Scholar]
- Reevaluation of the standardized uptake value for FDG: Variations with body weight and methods for correction. Radiology. 1999;213:521-5.
- [CrossRef] [PubMed] [Google Scholar]
- Effects of noise, image resolution, and ROI definition on the accuracy of standard uptake values: A simulation study. J Nucl Med. 2004;45:1519-27.
- [PubMed] [Google Scholar]
- Role of optimal quantification of FDG PET imaging in the clinical practice of radiology. Radiographics. 2016;36:481-6.
- [CrossRef] [PubMed] [Google Scholar]