Translate this page into:
Efficacy of dual-layer spectral detector computed tomography for detecting early ischemic changes in patients with acute ischemic stroke: A pilot study

*Corresponding author: Seitaro Oda, Department of Diagnostic Radiology, Kumamoto University, Chuo-ku, Kumamoto, Japan. seisei0430@nifty.com
-
Received: ,
Accepted: ,
How to cite this article: Honda K, Oda S, Kondo D, Kujirai R, Higuchi K, Osaki T et al. Efficacy of dual-layer spectral detector computed tomography for detecting early ischemic changes in patients with acute ischemic stroke: A pilot study. J Clin Imaging Sci. 2025;15:11. doi: 10.25259/JCIS_171_2024
Abstract
Objectives:
This study evaluated the efficacy of dual-layer spectral detector computed tomography (DLCT) for detecting early ischemic changes (EICs) in patients with acute ischemic stroke (AIS), focusing on electron density (ED) and effective atomic number (effective Z) imaging.
Material and Methods:
This retrospective study included 15 patients (mean age: 76.5 ± 9.8 years) with AIS who underwent non-contrast computed tomography (CT) with DLCT and magnetic resonance imaging (MRI) on the same day. Quantitative analysis was performed to compare conventional CT, ED, and effective Z values between the infarcted and contralateral brain regions. Qualitative assessment was conducted by two radiologists using the modified Alberta Stroke Program Early CT Score methodology. Receiver operating characteristic curve analysis was performed to evaluate diagnostic performance, and kappa statistics were used to assess interobserver agreement.
Results:
Significant differences were observed in the conventional CT and ED values (P < 0.01) but not in effective Z values (P = 0.46) between the infarcted and contralateral regions. ED imaging demonstrated superior diagnostic accuracy (area under curve [AUC] = 0.90) compared with conventional 120-kVp CT (AUC = 0.85) and effective Z imaging (AUC = 0.62). Furthermore, interobserver agreement (kappa = 0.71) was better for ED imaging than for conventional 120-kVp CT (kappa = 0.65). Qualitative analysis revealed that ED images showed better agreement with MRI findings and higher interobserver consistency than conventional 120-kVp images.
Conclusion:
Compared with conventional CT, DLCT with ED imaging significantly enhanced detection of EICs in AIS
Keywords
Ischemic stroke
Tomography
Electrons
Brain
Area under curve

INTRODUCTION
Acute ischemic stroke (AIS) is a critical neurological condition with significant health and economic impacts due to its high morbidity and mortality rates.[1] Early detection and intervention are crucial because they can greatly improve patient outcomes by enabling timely thrombolytic or endovascular therapies.[2] At present, non-contrast brain computed tomography (NCCT) is the primary imaging modality for emergency evaluation of acute stroke due to its rapid availability and ease of use.[3] However, NCCT often lacks sensitivity in identifying subtle early ischemic changes (EICs), such as hypo-attenuation or loss of the gray-white matter interface, both of which are vital for prompt AIS diagnosis. In normal brain tissue, the density difference between the gray and white matter regions is typically 5–10 Hounsfield units (HU). In the early stages of cerebral ischemia, this difference decreases to <5 HU, resulting in a very low contrast between the normal and affected tissues, which makes lesion detection challenging.[4,5] Advancements in CT technology, notably dual-layer spectral detector CT (DLCT), provide improved tissue characterization capabilities through spectral imaging, potentially addressing previous limitations in lesion detection. DLCT enables acquisition of both conventional and spectral images within a single scan by capturing spectral information from different photon energy levels. The derived parameters, such as the electron density (ED) and effective atomic number (effective Z), provide additional quantitative insights into the tissue composition and cellular changes.[6,7] These advanced CT imaging techniques may aid in detecting subtle EICs associated with cellular edema, which are challenging to identify by conventional NCCT; however, their effectiveness in AIS has not yet been investigated.
This study aimed to assess the efficacy of DLCT, with a particular focus on ED and effective Z, for detecting EICs in patients with AIS. In addition, it explores the potential of DLCT as a more accessible alternative to magnetic resonance imaging (MRI) in emergency clinical settings.
MATERIAL AND METHODS
Study population
This retrospective study was conducted according to the principles outlined in the Declaration of Helsinki and was approved by our Institutional Review Board. The need for patient informed consent was waived off given the retrospective nature of the study.
We retrospectively included 15 patients (eight males, seven females; mean age 76.5 ± 9.8 years) who had been diagnosed with AIS and underwent NCCT using DLCT (IQon Spectral CT, Philips Healthcare, Best, Netherlands) and brain MRI on the same day in an emergency setting between November 1, 2021, and April 30, 2023. Patients with contraindications to MRI or significant artifacts observed by either CT or MRI were excluded from the study. Patient characteristics are summarized in Table 1.
| Variable | Patients with AIS (n=15) |
|---|---|
| Male sex | 10 (66.7) |
| Age, years | 81.0 (75.0–89.5) |
| Hypertension | 9 (60.0) |
| Diabetes | 6 (40.0) |
| Coronary artery disease | 9 (60.0) |
| Smoking | 6 (40.0) |
| Previous stroke | 1 (6.7) |
| Alcoholism | 0 (0.0) |
| Onset to imaging, min | 60.4 (37.5–221.5) |
Data are expressed as median and interquartile range or as n and percentage. AIS: Acute ischemic stroke
Image acquisition
The parameters for NCCT imaging were detector collimation 64 × 0.625 mm, 500-ms tube rotation time, and 0.7 helical pitch (beam pitch). The tube voltage was 120 kVp, with tube current automatic exposure control (Dose Right Index: 39). The head was scanned from the foramen magnum to the skull end in a caudocranial direction. The mean CT dose index volume was 55.2 ± 5.42 mGy. Spectral image data were postprocessed on a dedicated workstation (Spectral Diagnostic Suite; Philips Healthcare) to generate ED and effective Z images. A standard brain kernel (UB) with hybrid iterative reconstruction (iDose4, level 4) was used to reconstruct conventional 120-kVp images. The slice thickness for all types of reconstructed images was 5 mm.
All patients underwent 3.0-T MRI (Ingenia Elition 3.0T; Philips Healthcare). A 16-channel head coil was used to acquire the image signal. The standard brain MRI protocols included diffusion-weighted imaging, T1- and T2-weighted imaging, time-of-flight MR angiography, and susceptibility-weighted imaging. Diffusion-weighted imaging was performed with b-values of 0 and 1000 s/mm2, and an apparent diffusion coefficient map was generated. An echo planar imaging (EPI) sequence was used with a repetition time of 4269 ms and echo time of 68 ms. The pixel size and slice thickness were 1.51 × 1.45 mm and 5.0 mm, respectively, across 24 slices. The total scan duration was 51 s. Additional parameters included a flip angle of 90°, number of signal averages of 1, and EPI factor of 65. The field of view was 230 mm, with a compressed SENSE factor of 2.7. Diffusion-weighted imaging was used as the reference standard to confirm the AIS regions.
Quantitative image analysis
A board-certified radiologist with 15 years of experience in NCCT performed quantitative image analysis on conventional 120-kVp, ED, and effective Z images. A circular region of interest (ROI) of approximately 100 mm2 was used to measure the mean AIS area, confirmed by diffusion-weighted MRI imaging. A circular ROI of 100 mm2 was also placed on the contralateral side in the region corresponding to the infarcted area.
Qualitative image analysis
Qualitative image analysis was performed on conventional 120-kVp and ED images. The window level and image widths were adjusted as needed during the evaluation. Two board-certified radiologists, with 8 and 19 years of experience in neuroimaging, independently evaluated the presence or absence of AIS on two slices corresponding to the Alberta Stroke Program Early CT score (ASPECTS), with MRI as the reference standard. The evaluators were blinded to the patients’ clinical symptoms and physical examination findings. ASPECTS is a standardized scoring system used to evaluate EICs in the middle cerebral artery territory on NCCT scans. Application of ASPECTS divided the middle cerebral artery region into 10 areas. In our study, we evaluated a total of 28 areas: 20 in both hemispheres assessed using the ASPECTS, 4 in the anterior cerebral artery territory, and 4 in the posterior cerebral artery territory.
Statistical analysis
Quantitative image analysis using paired t-tests was performed to compare the values obtained from NCCT images of AIS and contralateral normal areas. The area under curve (AUC) from receiver operating characteristic (ROC) analysis was used to assess diagnostic performance of the quantitative values obtained from the conventional 120-kVp, ED, and effective Z images for AIS lesions.
In qualitative image analysis, the accuracy, sensitivity, specificity, and AUC from ROC analysis were used to assess the observers’ diagnostic performance by examining the conventional 120-kVp and ED images. To evaluate the interobserver agreement in the qualitative analysis, we interpreted the kappa coefficients as follows: <0.20 = slight, 0.21–0.40 = fair, 0.41–0.60 = moderate, 0.61–0.80 = good, and 0.81–1.00 = excellent. P < 0.05 was considered statistically significant. The Bell Curve for Excel (Social Survey Research Information) and MedCalc (version 11.2; MedCalc) were used to perform all statistical analyses.
RESULTS
Quantitative image analysis
Statistically significant differences were identified in CT (28.2 ± 3.9 HU vs. 33.4 ± 2.3 HU, P < 0.01) and ED values (102.4 ± 0.4 %ED relative to water (%EDW) [ED relative to water] vs. 102.9 ± 0.17 %EDW, P < 0.01) but not in effective Z values (7.4 ± 0.04 vs. 7.4 ± 0.04, P = 0.46) between the infarcted and contralateral regions [Figure 1]. Diagnostic performance of the quantitative values derived from the conventional 120-kVp, ED, and effective Z images was evaluated for each type. ROC analysis revealed AUC values of 0.85, 0.90, and 0.62 for the conventional 120 kVp, ED, and effective Z images, respectively. For conventional 120-kVp images, the optimal cutoff value was 30.1 HU, with a diagnostic performance of sensitivity 0.69, specificity of 1.00, positive predictive value (PPV) of 1.00, and negative predictive value (NPV) of 0.77. The optimal cutoff for ED was 102.7 %EDW, with sensitivity of 0.81, specificity of 1.00, PPV of 1.00, and NPV of 0.84. For effective Z imaging, the optimal cutoff was 7.32, sensitivity of 0.23, specificity of 1.00, PPV of 1.00, and NPV of 0.57 [Figure 2].
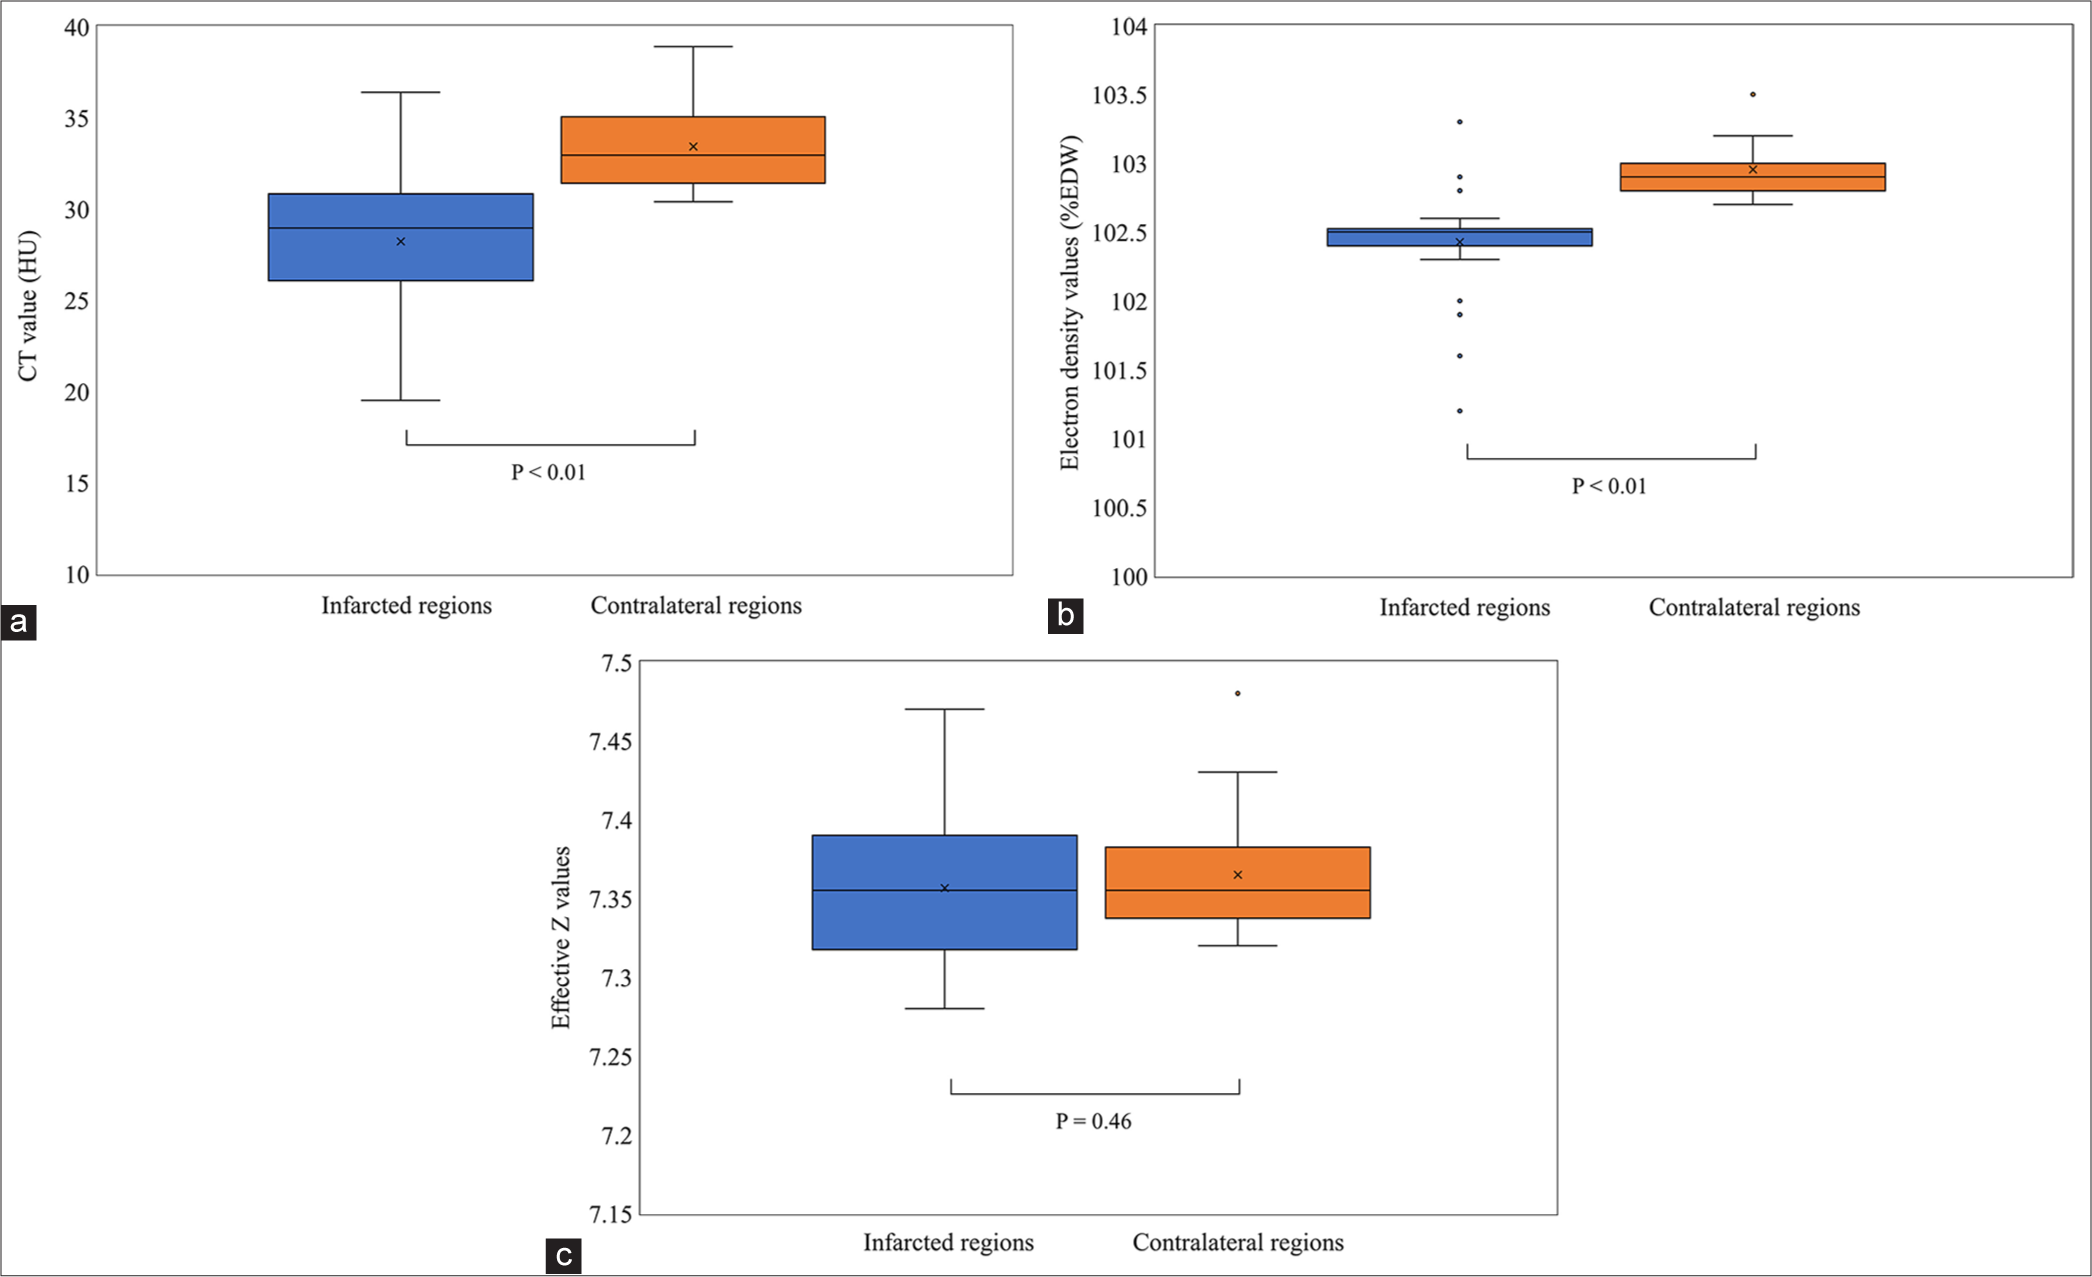
- Quantitative image analysis. (a) Conventional 120 kVp images, (b) ED images, (c) Effective Z images. Box plots illustrating the results of the quantitative image analysis for conventional 120 kVp (a), ED (b), and effective Z (c) images.
![Comparison of receiver operating characteristic curves of the quantitative image parameters. The diagnostic accuracy of electron density imaging was superior (area under curve [AUC] = 0.90) compared with that of conventional 120-kVp CT (AUC = 0.85) and effective Z imaging (AUC = 0.62). (CT: Computed tomography).](/content/12/2025/15/1/img/JCIS-15-11-g002.png)
- Comparison of receiver operating characteristic curves of the quantitative image parameters. The diagnostic accuracy of electron density imaging was superior (area under curve [AUC] = 0.90) compared with that of conventional 120-kVp CT (AUC = 0.85) and effective Z imaging (AUC = 0.62). (CT: Computed tomography).
Qualitative image analysis
In qualitative analysis, the area-based concordance with MRI for observer 1 demonstrated a kappa value of 0.33 for the conventional 120-kVp images and 0.63 for ED images, whereas for observer 2, kappa value was 0.29 for the conventional 120-kVp images and 0.57 for ED images. In ROC analysis, AUC values for observer 1 were 0.62 (95% confidence interval [CI], 0.57–0.67) for the conventional 120-kVp images and 0.78 (95% CI, 0.74–0.82) for ED images, whereas for observer 2, AUC values were 0.60 (95% CI, 0.55– 0.65) for the conventional 120-kVp images and 0.75 (95% CI, 0.71–0.79) for ED images [Figure 3]. The interobserver agreement between observers 1 and 2 yielded a kappa value of 0.65 for the conventional 120-kVp images and 0.71 for ED images. Figures 4 and 5 present representative cases of AIS.
![Comparison of ROC curves in the qualitative image analysis. (a) area under the curve (AUC) values for observer 1 and (b) observer 2. In ROC analysis, area under the curve (AUC) values for observer 1 (a) were 0.62 (95% confidence interval [CI], 0.57–0.67) for conventional 120-kVp images and 0.78 (95% CI, 0.74–0.82) for ED images, whereas for observer 2 (b), AUC values were 0.60 (95% CI, 0.55–0.65) for the conventional 120-kVp images and 0.75 (95% CI, 0.71–0.79) for ED images.](/content/12/2025/15/1/img/JCIS-15-11-g003.png)
- Comparison of ROC curves in the qualitative image analysis. (a) area under the curve (AUC) values for observer 1 and (b) observer 2. In ROC analysis, area under the curve (AUC) values for observer 1 (a) were 0.62 (95% confidence interval [CI], 0.57–0.67) for conventional 120-kVp images and 0.78 (95% CI, 0.74–0.82) for ED images, whereas for observer 2 (b), AUC values were 0.60 (95% CI, 0.55–0.65) for the conventional 120-kVp images and 0.75 (95% CI, 0.71–0.79) for ED images.
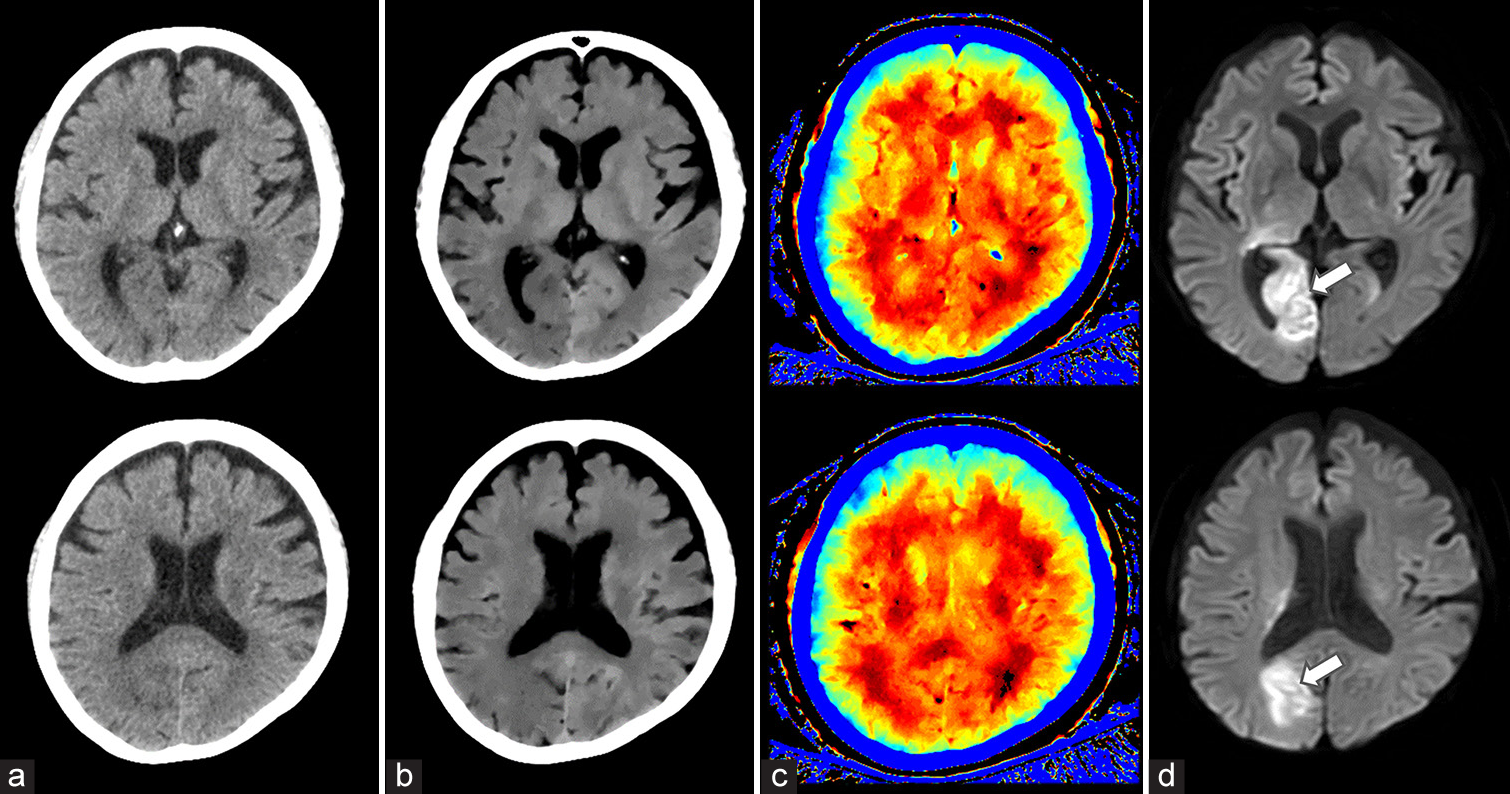
- A 69-year-old woman with acute ischemic stroke (AIS) in the right occipital lobe. (a) 120 kVp images, (b) ED images, (c) effective Z images, (d) MRI images. Diffusion-weighted MRI revealed an abnormal signal (arrow) in the right occipital lobe. The lesion was poorly visualized on the conventional 120-kVp image but was clearly identifiable on ED imaging. Effective Z imaging demonstrated only a slight difference between the left and right occipital lobes.
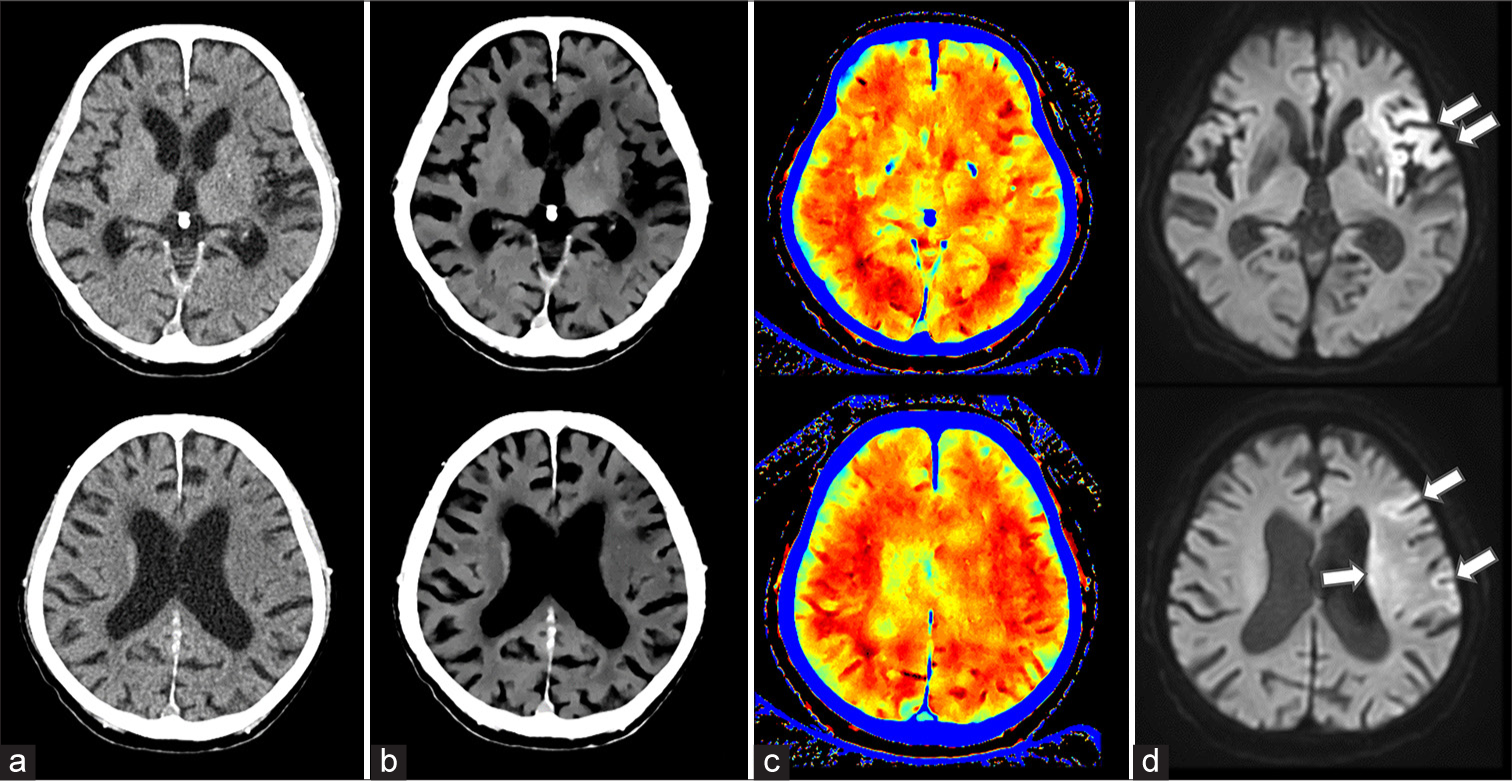
- A 93-year-old man with acute ischemic stroke (AIS) in the left middle cerebral artery territory. (a) 120 kVp images, (b) ED images, (c) effective Z images, (d) MRI images. Diffusion-weighted MRI revealed an abnormal signal (arrow) in the left middle cerebral artery. The lesion was poorly visualized on the conventional 120-kVp image but was clearly identifiable on ED imaging. Effective Z imaging showed a discernible difference between the left and right sides.
DISCUSSION
In this study, we found statistically significant differences in CT (P < 0.01) and ED values (P < 0.01), but not in the effective Z values, between the infarcted and contralateral brain regions. ROC analysis demonstrated that the diagnostic performance of ED imaging was superior to that of conventional 120-kVp imaging and effective Z measurements. Qualitative analysis showed that ED images demonstrated better agreement with MRI and higher interobserver consistency, with the kappa values reflecting improved diagnostic accuracy and reliability over the conventional 120-kVp images.
DLCT uses a dual-layer detector design in which lower-energy photons are absorbed by an upper scintillator layer and higher-energy photons by a lower layer, enabling spectral data acquisition in a single scan. ED imaging, derived from DLCT, facilitates quantitative tissue characterization by calculating ED relative to water. The probability of Compton scattering is proportional to the number of electrons within a material, that is, ED. Materials with higher ED provide more opportunities for X-rays to interact with electrons, resulting in frequent Compton scattering. Consequently, tissues or materials with high ED show greater Compton scattering when exposed to X-rays. This principle facilitates ED estimation by quantifying Compton scattering across various tissues or materials. For substances with low atomic numbers, such as water and fat, in which Compton scattering predominates, ED imaging adjusted for this effect may be particularly valuable in NCCT. In particular, ED imaging is expected to enhance the visual differentiation of pathologies, such as organ edema, inflammation, and thrombotic lesions, without the use of contrast agents.
Rodriguez-Granillo et al. investigated the utility of ED imaging obtained through DLCT for identifying thrombi without contrast agents.[8] Moreover, in this vitro study, thrombus samples from mechanical thrombectomy were scanned using ED imaging, conventional CT, and low-monoenergetic imaging; ED imaging had significantly higher signal-to-noise and contrast-to-noise ratios, providing more accurate thrombus visualization. These findings suggest the potential of ED imaging for thrombus detection in patients who are ineligible for contrast-enhanced CT. Bae and Jeon reported a case of acute pulmonary embolism (PE) detected using ED imaging from an unenhanced dual-energy CT.[9] In an elderly patient presenting with pneumonia symptoms, conventional NCCT showed no signs of PE. However, retrospective ED imaging revealed multiple high-density areas in the pulmonary arteries that corresponded to thrombus locations confirmed later by contrast-enhanced CT pulmonary angiography. This case highlights the potential of ED imaging for identifying PE in patients in whom contrast-enhanced imaging cannot be performed. As mentioned above, although several reports have highlighted the efficacy of ED imaging for thrombus evaluation, our study is the first to demonstrate the utility of ED imaging in NCCT for AIS. The findings from our study demonstrated that DLCT, specifically using ED imaging, enhanced the detection of EICs in patients with AIS compared with that using conventional CT. By providing additional quantitative insights, DLCT may reduce the reliance on MRI for urgent diagnosis, potentially expediting treatment initiation. This advancement is particularly beneficial for clinical settings in which MRI access is limited, ultimately supporting timely intervention and improved patient outcomes in acute stroke care.
Nagano et al. evaluated the use of ED derived from DLCT for diagnosing metastatic mediastinal lymph nodes in non-small-cell lung cancer.[10] In a study on 57 patients, ED values were significantly lower in the metastatic nodes than in nonmetastatic nodes. Combining ED with short-axis diameter or [18F]-fluorodeoxyglucose uptake on PET/CT improved the diagnostic accuracy, surpassing that of individual parameters, suggesting the potential for expanding clinical applications of ED imaging to the field of oncology.
In dual-energy CT, effective Z imaging provides valuable clinical insights by enabling material differentiation based on the elemental composition. This capability is particularly useful for distinguishing between tissues with similar densities but different atomic structures, such as for characterizing arterial plaques in vascular imaging[11-13] or assessing tumor tissue characteristics in oncological evaluations.
Our results indicated that effective Z imaging was not functional for evaluating AIS, probably due to the similarity in atomic numbers between the infarcted and non-infarcted areas. In contrast, ED imaging, which reflects differences in tissue Compton scattering, proved to be more effective for detecting AIS in the NCCT setting.
There were several limitations in this study. First, as a single-center study with a limited sample size, our findings require validation in larger prospective studies to ensure generalizability. Second, this study used a specific dual-energy CT system, DLCT system, and a single scanner; therefore, it is unclear if similar results would be obtained when using other dual-energy systems or different equipment. Third, during the qualitative assessment, we adjusted the window settings as needed when visually interpreting the ED images. Future research should investigate the optimal window settings for ED images to standardize and improve the diagnostic accuracy. Finally, unlike diffusion-weighted MRI, abnormalities detected on ED images are non-specific. Therefore, the interpretation of ED images should be conducted in conjunction with the clinical symptoms and physical examination findings to provide a comprehensive assessment.
CONCLUSION
DLCT demonstrated significant advantages in detecting EICs in AIS, with higher diagnostic accuracy and interobserver agreement obtained with ED imaging than with conventional CT imaging. These findings suggest that ED imaging can improve lesion visualization, potentially enhancing diagnostic reliability in emergency stroke settings.
Ethical approval
The research/study was approved by the Institutional Review Board at Kumamoto Chuo Hospital, number 202305-01, dated May 17, 2023.
Declaration of patient consent
Patient’s consent not required as patients identity is not disclosed or compromised.
Conflicts of interest
Mr. Ryusuke Kujirai and Mr. Ko Higuchi are employees of Philips Japan, Ltd. The other authors declare no conflicts of interest.
Use of artificial intelligence (AI)-assisted technology for manuscript preparation
The authors confirm that there was no use of artificial intelligence (AI)-assisted technology for assisting in the writing or editing of the manuscript and no images were manipulated using AI.
Financial support and sponsorship
Nil.
References
- Incidence and mortality rates of acute ischemic stroke in hospitalized patients in the United States. Arch Med Sci Atheroscler Dis. 2021;6:e132-4.
- [CrossRef] [PubMed] [Google Scholar]
- From “time is brain” to “imaging is brain”: A paradigm shift in the management of acute ischemic stroke. J Neuroimaging. 2020;30:562-71.
- [CrossRef] [PubMed] [Google Scholar]
- Guidelines for the early management of patients with acute ischemic stroke: 2019 Update to the 2018 guidelines for the early management of acute ischemic stroke: A guideline for healthcare professionals from the American Heart Association/American Stroke Association. Stroke. 2019;50:e344-418.
- [CrossRef] [Google Scholar]
- Validity and reliability of a quantitative computed tomography score in predicting outcome of hyperacute stroke before thrombolytic therapy. ASPECTS Study Group. Alberta Stroke Programme Early CT Score. Lancet (London, England). 2000;355:1670-4.
- [CrossRef] [Google Scholar]
- Using the baseline CT scan to select acute stroke patients for IV-IA therapy. AJNR Am J Neuroradiol. 2006;27:1612-6.
- [Google Scholar]
- Dual-layer spectral computed tomography: measuring relative electron density. Eur Radiol Exp. 2018;2:20.
- [CrossRef] [PubMed] [Google Scholar]
- Accuracy of electron density, effective atomic number, and iodine concentration determination with a dual-layer dual-energy computed tomography system. Med Phys. 2018;45:2486-97.
- [CrossRef] [PubMed] [Google Scholar]
- Thrombus discrimination with electron density: Potential implications for non-contrast computed tomography imaging. Cardiovasc Diagn Ther. 2024;14:304-10.
- [CrossRef] [PubMed] [Google Scholar]
- Diagnosis of pulmonary embolism in unenhanced dual energy CT using an electron density image. Diagnostics (Basel). 2021;11:1841.
- [CrossRef] [PubMed] [Google Scholar]
- Dual-energy CT-derived electron density for diagnosing metastatic mediastinal lymph nodes in non-small cell lung cancer: comparison with conventional CT and FDG PET/CT findings. AJR Am J Roentgenol. 2022;218:66-74.
- [CrossRef] [PubMed] [Google Scholar]
- Clinical feasibility of using effective atomic number maps derived from non-contrast spectral computed tomography to identify noncalcified atherosclerotic plaques: A preliminary study. Quant Imaging Med Surg. 2022;12:2280-7.
- [CrossRef] [PubMed] [Google Scholar]
- Clinical application of effective atomic number for classifying non-calcified coronary plaques by dual-energy computed tomography. Atherosclerosis. 2017;261:138-43.
- [CrossRef] [PubMed] [Google Scholar]
- Application of dual-layer spectral-detector computed tomography angiography in identifying symptomatic carotid atherosclerosis: A prospective observational study. J Am Heart Assoc. 2024;13:e032665.
- [CrossRef] [PubMed] [Google Scholar]