Translate this page into:
Basic verification of myocardial extracellular volume quantification by prototype photon-counting detector computed tomography: A phantom study
 , Kana Tanaka3, Fuyuhiko Teramoto3, Masafumi Kidoh1, Yasunori Nagayama1, Takeshi Nakaura1, Toshinori Hirai1

*Corresponding author: Seitaro Oda, Department of Diagnostic Radiology, Kumamoto University, Kumamoto, Japan. seisei0430@nifty.com
-
Received: ,
Accepted: ,
How to cite this article: Oda S, Funama Y, Kojima S, Yokoi K, Takahashi I, Aoki Y, et al. Basic verification of myocardial extracellular volume quantification by prototype photon-counting detector computed tomography: A phantom study. J Clin Imaging Sci. 2025;15:8. doi: 10.25259/JCIS_157_2024
Abstract
Objectives:
This study aimed to investigate the accuracy of myocardial extracellular volume (ECV) quantification using a prototype photon-counting detector (PCD) computed tomography (CT) and examine the association between radiation dose and spectral image settings.
Material and Methods:
A multi-energy CT phantom that simulated the blood pool and myocardium was used. The tube voltage was set at 120 kVp and three types of tube current-time products (105, 150, and 300 mAs) were applied for pre- and post-contrast scans. Virtual monoenergetic images (VMIs) at 50–100 keV were reconstructed. The ECV value was calculated from the CT numbers between pre-contrast and post-contrast. We compared the accuracy of ECV values at each VMI level.
Results:
Each radiation dose setting demonstrated a small but significant difference in ECV values at each keV level. ECV was overestimated at higher keV in all radiation dose settings. A significant difference in ECV value variabilities was found among keV levels in all three radiation dose settings, with higher keV exhibiting greater variability. The variation was particularly large in the low-dose setting. The residual values were significantly larger at higher keV levels in all radiation dose settings. The residual values were smaller at 50 and 60 keV with no significant difference in 150- and 300-mAs settings.
Conclusion:
Setting appropriate VMI keV and radiation dose settings was necessary when quantifying myocardial ECV with PCD-CT because the keV levels caused differences in the quantification value and measurement variation.
Keywords
Myocardial extracellular volume
Photon-counting detector computed tomography
Virtual monoenergetic imaging
Phantom study

INTRODUCTION
Myocardial fibrosis is a crucial issue in various cardiac conditions, including chronic heart failure, valvular heart disease, diabetic cardiomyopathy, atrial fibrillation, and sudden cardiac death.[1-4] It is frequently considered a predominant pathological alteration in most myocardial diseases and a significant factor in ventricular remodeling.[3] Late gadolinium enhancement cardiac magnetic resonance (CMR) is effective in detecting focal or replacement myocardial fibrosis, but its limitation lies in the inability to determine diffuse myocardial fibrosis. In contrast, myocardial extracellular volume (ECV), measured through CMR, provides a valuable alternative for diffuse myocardial fibrosis.[5,6] Previous studies have emphasized the significance of myocardial ECV and recommended its consideration in the diagnostic evaluation of heart failure and its strong association with adverse cardiac outcomes in various myocardial diseases.[5-7]
CMR imaging has its constraints, such as longer acquisition times, limited imaging sections, and contraindications, including claustrophobia or implantable electronic devices, despite being the reference standard for noninvasive myocardial fibrosis assessment. Contrastingly, computed tomography (CT) has become widely used in cardiovascular imaging, particularly in coronary CT angiography (CCTA), providing detailed coronary anatomy and plaque characteristics for accurate risk stratification and therapy monitoring.[8] In addition, cardiac CT has been routinely used in pre-operative planning and post-operative follow-up of patients undergoing transcatheter aortic valve implantation (TAVI).[9] Recent advances in cardiac CT allowed ECV acquisition from late iodine-enhanced (LIE) scans after CCTA, especially in patients already undergoing CT for other indications, thereby bypassing some CMR limitations.[10-12]
Initially, an energy-integrating detector-based CT single-energy method was introduced for myocardial ECV quantification, requiring unenhanced images followed by a LIE scan.[13-15] Subsequently, dual-energy technology appeared, enabling iodine-based CT map creation for precise ECV quantification.[16-18] However, the adoption of dual-energy CT into guidelines and clinical practice has been constrained despite its potential, possibly due to the compromised temporal resolution and increased radiation related to dual-energy acquisitions on the energy-integrating detector CT platform.
In contrast, compared to energy-integrating detector CT, photon-counting detector (PCD)-CT maintains optimal temporal resolution for spectral acquisitions while providing improved spatial and contrast resolution, enhanced image quality, and comprehensive spectral data with each acquisition.[19-22] These advancements in cardiac imaging potentially reduced radiation exposure, minimized beam hardening and metal artifacts, increased CCTA specificity in coronary artery disease diagnosis, and improved detection of myocardial tissue characteristics and ischemia.[23-26]
Some initial studies reported on ECV quantification using PCD-CT, but standard imaging protocols remain unknown, and the influence of radiation dose and spectral image settings is still unclear.
The present study aimed to investigate the accuracy of ECV quantification using prototype PCD-CT and evaluate the influence of radiation dose and spectral image settings.
MATERIAL AND METHODS
This was a phantom study, and thus, ethical approval was not required.
Phantom
The central portion of a multi-energy CT phantom (Sun Nuclear Corporation, Middleton, WI, USA) was utilized in our phantom study. The phantom was circular with length, height, and width of 20 cm, 20 cm (in-plane dimension), and 16.5 cm (z-direction), respectively.[27] Two types of solid cylindrical inserts for soft-tissue materials were prepared to mimic the blood pool and myocardium on pre-contrast-enhanced CT. Moreover, two types of soft tissues, including iodinated contrast materials (2 and 4 mgI/mL), were prepared to mimic blood pool and myocardial iodine enhancement on postcontrast-enhanced CT. The water material was inserted to measure the image noise.
First, the solid cylindrical inserts corresponding to the water, blood, and soft tissue were inserted into the phantom, and CT images were obtained through pre-contrast-enhanced CT. Then, the last two inserts were changed to blood with iodine and soft tissue with iodine, and CT images were obtained through postcontrast-enhanced CT [Figure 1].
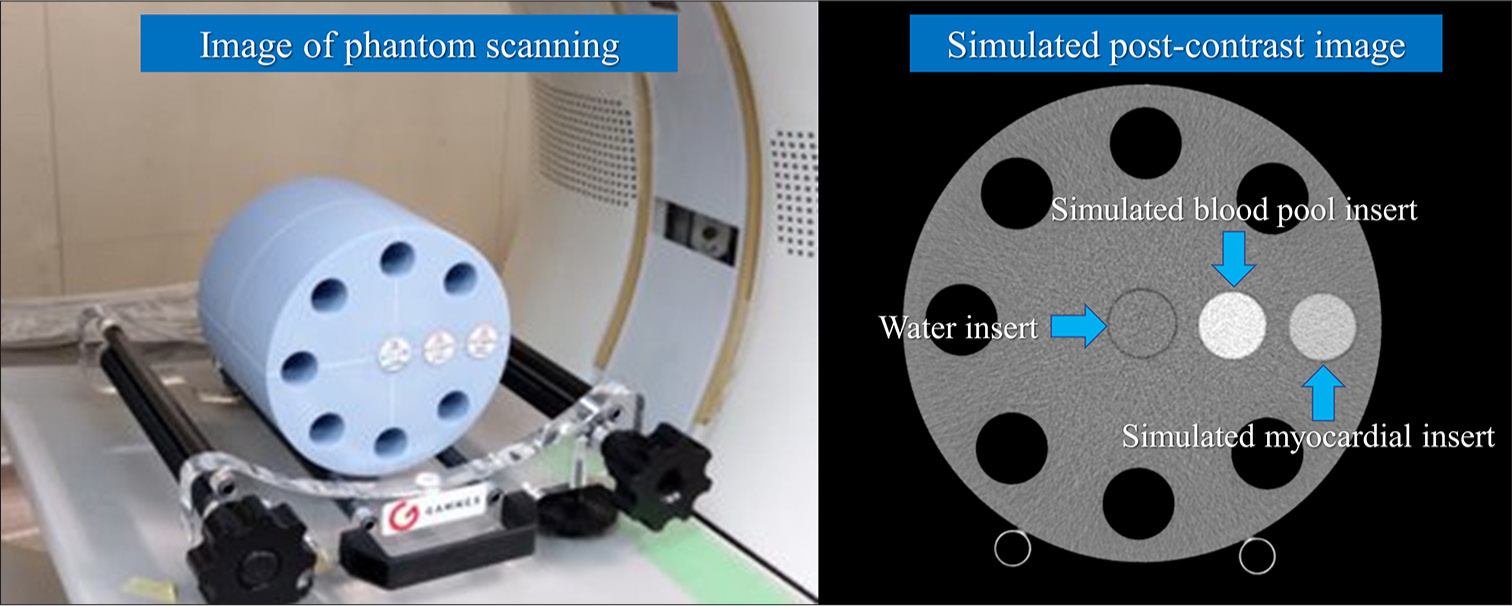
- Computed tomography (CT) phantom and reconstructed image. This phantom (Multi-energy CT phantom, Gammex, Middleton, WI, USA) was circular with length, height, and width of 20 cm, 20 cm (in-plane dimension), and 16.5 cm (z-direction), respectively. Solid cylindrical inserts simulate the myocardium and blood pool, and water inserts were utilized (blue arrows).
PCD-CT scanning
The conventional axial scan mode was used for CT scans on a prototype PCD-CT (FUJIFILM Corporation, Tokyo, Japan). The scanner parameters for the PCD-CT scan were as follows: Tube voltage of 120 kVp; tube current-time product of 105 mAs, 150 mAs, and 300 mAs; detector configuration of 16 × 0.625mm; gantry rotation time, 0.35, 0.5, and 1.0 s; slice thickness of 0.625 mm; slice interval of 0.625 mm; display field of view of 220 mm × 220 mm; and matrix size of 512 × 512.
First, two types of soft tissues were inserted into the phantom and scanned using the said conditions, assuming pre-contrast CT. Next, two types of soft tissues, including iodine contrast materials, were inserted into the same positions as pre-contrast CT and scanned using the same conditions, assuming postcontrast-enhanced CT. Simulated pre-contrast CT and post-contrast CT scans were performed thrice each. Virtual monoenergetic images (VMIs) were reconstructed at 50–100 keV with 10-keV intervals for each pre-contrast and post-contrast CT. Table 1 summarizes the acquisition parameters for PCD-CT.
| Platform | 64 row-MDCT of FUJIFILM healthcare corporation |
|---|---|
| Field of view | 220 mm (matrix size 512×512) |
| Gantry rotation | 0.35, 0.5, and 1.0 s |
| Tube voltage | 120 kVp |
| Tube current | 300 mA (105 mAs, 150 mAs, and 300 mAs) |
| Focal spot | 1.2×1.4 mm |
| Detector mode | Multi-energy discrimination mode |
| Energy bins | 4 |
| Z-cover in iso-center | 10 mm |
| Number of scans | 3 |
| Number of reconstructed images | 16 images/scan (slice thickness of 0.625 mm) |
| Reconstruction images | 50–100 with 10-keV intervals |
| Reconstruction filter | Abdominal standard filter |
PCD: Photon-counting detector, CT: Computed tomography
ECV quantification
Quantitative analysis of CT number and image noise was performed. A 15 mm diameter region of interest (ROI) was used to measure the CT numbers for two types of soft-tissue-simulated blood pool and myocardium, and the mean value of 16 images/scan and 3 scans along the z-axis was calculated for each keV image of VMI. In addition, the same ROI and the same number of images were used to determine the CT number for two types of iodinated soft-tissue-simulated blood pool and myocardial iodine enhancement. The central portion of the water insert in the phantom images was used to calculate the standard deviation (SD) of the image pixel values. Each ROI was calculated with the mean value from 16 images/scan and 3 scans along the z-axis for each keV image of VMI [Figures 2 and 3].
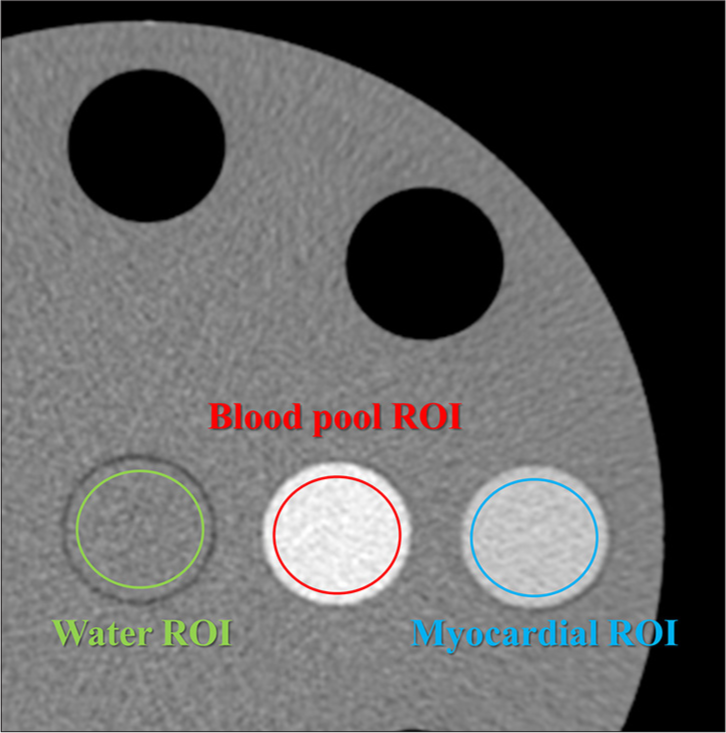
- Measurement of computed tomography (CT) number. Region of interests (ROIs) were used to measure the CT numbers, and the mean value of 16 images/scan and 3 scans along the Z-axis was calculated for each keV image of virtual monoenergetic image. (The green circle represents the ROI for water, the red circle represents the ROI for the blood pool, and the blue circle represents the ROI for the myocardium).
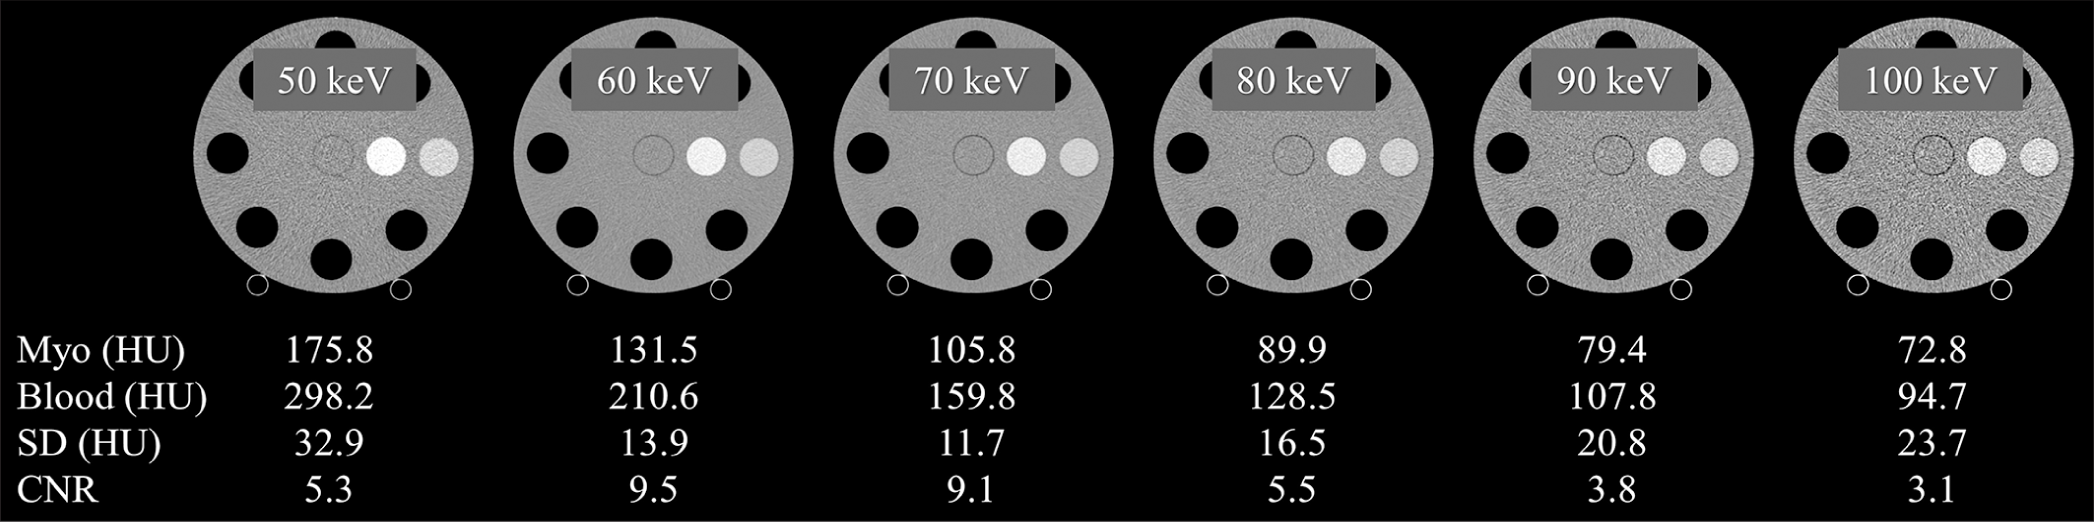
- Computed tomography (CT) number, image noise (standard deviation), and contrast-to-noise ratio (CNR) for each keV image. CNRs were calculated based on the CT values of water and myocardium in the postcontrast images. The display window level/width is 0/600, 0/500, 0/400, 0/350, 0/300, and 0/250 for 50 keV, 60 keV, 70 keV, 80 keV, 90 keV, and 100 keV, respectively. (HU: Hounsfield unit).
The CT-derived ECV value in the clinical situation was calculated for the global midventricular wall and each segment using the equation:
CT-derived ECV = (1 – hematocrit) × (ΔMyo/ΔBlood), where ΔMyo is myocardial Hounsfield unit (HU) (post-contrast – pre-contrast) and ΔBlood is blood pool HU (post-contrast – pre-contrast).
Our phantom study calculated the CT-derived ECV value based on the equation:
CT-derived ECV = (1 – hematocrit) × (postMyo – preMyo)/(postBlood – preBlood), where postMyo and preMyo are simulated myocardium HU in postcontrast and pre-contrast CT, whereas postBlood and preBlood are simulated blood HU in postcontrast and pre-contrast CT, respectively, with a hematocrit of 0.5. The theoretical reference ECV value is 0.25 (25%) under these conditions.
The mean ECV value was calculated using the ECVs of 16 images/scan and three scans along the z-axis at each keV setting.
The contrast-to-noise ratios in each keV image of VMI were also calculated based on the CT values of water and myocardium in the postcontrast images.
Statistical analysis
All numeric values are presented as means ± SD unless otherwise stated. Data were obtained for the mean ECV values, measured ECV SD, and the measured and reference ECV residual values at each keV setting. One-way analysis of variance was used for multiple comparisons of quantitative values with the Bonferroni post hoc test for significance between paired groups. P < 0.05 was considered statistically significant. BellCurve for Excel (Social Survey Research Information Co., Ltd., Tokyo, Japan) and MedCalc (MedCalc Software, Mariakerke, Belgium) were used for all statistical analyses.
RESULTS
Measured ECV values
We observed a consistent pattern of small yet statistically significant differences across all radiation dose settings and keV levels. Particularly, ECV values exhibited an overestimation trend at higher keV levels, regardless of the radiation dose used [Figure 4].
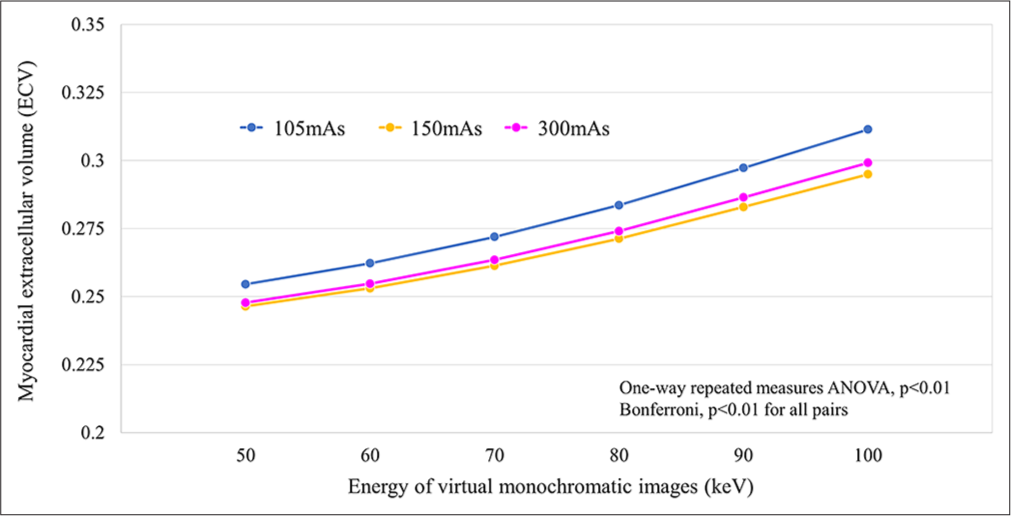
- Association between measured extracellular volume values at each radiation dose setting and each virtual monoenergetic image keV level. (ANOVA: Analysis of variance).
Our study revealed a significant difference in the variance of ECV values across different keV levels, regardless of the radiation dose configuration. Notably, higher keV levels were related to greater SD in ECV measurements. This variance was most pronounced in the low-dose setting (105 mAs), indicating a heightened variability level under such conditions [Figure 5].
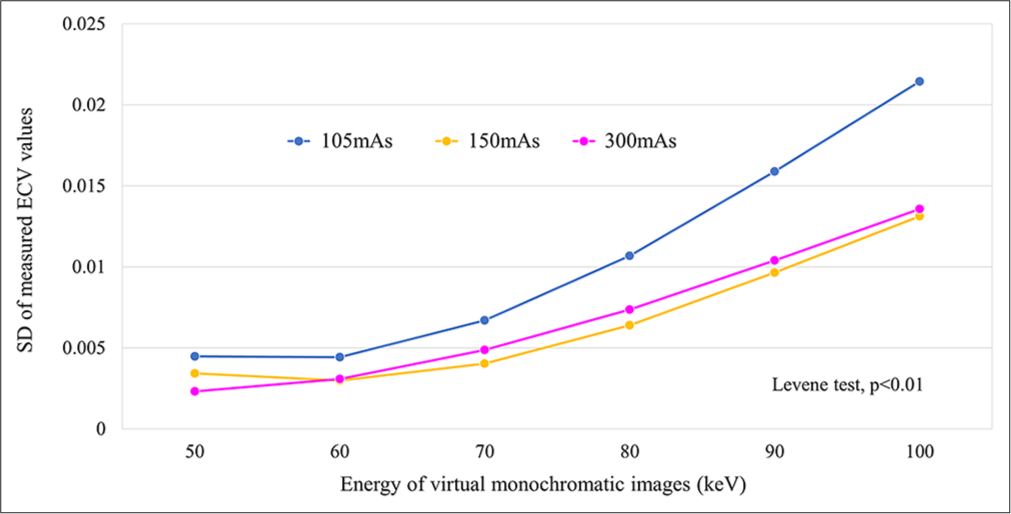
- Association between variance of measured extracellular volume values at each radiation dose setting and each virtual monoenergetic image keV level. (ECV: Extracellular volume, SD: Standard deviation).
Residual value for ECV measurement
We observed significantly larger residual values at higher keV levels across all radiation dose settings. Specifically, average residual values at 105-, 150-, and 300-mAs settings were 0.5– 6.1%, 0.4–4.5%, and 0.3–4.9%, respectively. Note worthily, residual values were comparatively smaller at 50- and 60-keV levels in 150- and 300-mAs settings, with no discernible significant difference [Figure 6].
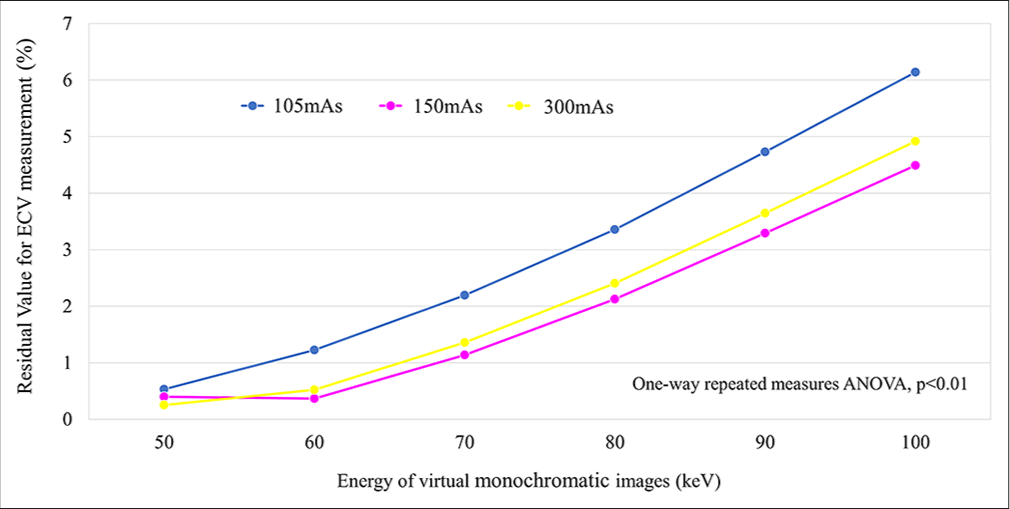
- Association between residual values for measured extracellular volume at each radiation dose setting and each virtual monoenergetic image keV level. (ANOVA: Analysis of variance, ECV: Extracellular volume).
DISCUSSION
Our investigation of phantom studies using PCD-CT generated distinctive results regarding ECV measurements. We consistently observed small yet statistically significant differences across all radiation dose settings and keV levels, with a possible ECV value overestimation at higher keV levels, regardless of the radiation dose used. In addition, we determined a substantial variance in ECV values across different keV levels, regardless of the radiation dose configuration, with higher keV levels demonstrating greater SD, particularly pronounced at the low-dose setting (105 mAs). Furthermore, we observed significantly greater residual values at higher keV levels across all radiation dose settings. These residuals may be improved by refining the use of the energy information derived from the system. On the other hand, the 150- and 300-mAs settings exhibited smaller residual values at 50- and 60-keV levels, allowing accurate ECV quantification.
The image quality of VMI, that is, contrast and image noise, generated by this PCD-CT scanner may have affected the accuracy of ECV quantification. In particular, contrast may be a major factor in ECV quantification errors. Specifically, lower contrast was observed at higher keV settings (≥70 keV) compared to 50 keV and 60 keV settings. At lower contrast at higher keV settings, even small CT value errors may have a large contribution to ECV accuracy degradation. As an additional factor, increased image noise at lower radiation dose settings could also contribute to the diminished ECV quantification accuracy. These combined factors may have contributed to the error in measuring the difference in CT values between the simulated myocardial tissue and the blood pool and then calculating the ECV. Image quality improvements are anticipated in PCD-CT with ongoing CT technology advancements. For instance, the integration of deep learning-based CT reconstruction techniques,[28] currently used in energy-integrating detector-based CT, will be implemented in PCD-CT scanners in the near future, thereby substantially improving image quality.
This study evaluated the ECV based on CT numbers. However, ECV quantification in PCD-CT based on iodine density is achievable through spectral analysis. Our future aim is to validate ECV quantification based on iodine density using PCD-CT. Utilizing analysis grounded on iodine density can improve the precision of ECV quantification with PCD-CT.
Mergen et al. conducted a study to investigate the feasibility and accuracy of quantifying ECV using dual-source PCDCT (NAEOTOM Alpha; Siemens Healthineers).[29] They included 30 patients with severe aortic stenosis undergoing pre-procedural workup for TAVI. The study used dual-energy iodine density-based ECV quantification and concluded that dual-source PCD-CT enabled sufficient ECV quantification at a low radiation dose. However, they did not compare ECV results with those obtained via CMR, which is considered the reference standard modality; thus, they could not definitively comment on the accuracy of PCD-CT in ECV quantification. Moreover, they should have thoroughly investigated imaging and image reconstruction parameter optimization.
Aquino et al. conducted a study comparing ECV quantification using a dual-source PCD-CT (NAEOTOM Alpha; Siemens Healthineers) with CMR.[26] They revealed strong correlations between ECV measurements obtained from dual-energy (iodine-based) and single-energy (CT number-based) PCD-CT scans (r = 0.91). Dual-energy PCDCT demonstrated a 40% lower radiation dose compared to single-energy PCD-CT. Dual-energy PCD-CT demonstrated strong correlations when compared to CMR (r = 0.91) but with a slight ECV overestimation (approximately 2%). Single-energy PCD-CT exhibited a similar association with CMR but slightly underestimated ECV (by 3%). However, they did not evaluate the imaging techniques, image reconstruction methods, and image quality of PCD-CT. Optimizing the imaging parameters is crucial for the clinical implementation of ECV quantification using PCD-CT.
The present study has some limitations. First, our phantom study did not account for cardiac motion, which could potentially affect both image quality and ECV quantification accuracy during clinical imaging of patients. In addition, factors, such as patient dimensions and artifacts originating from ribs and vertebrae, may influence ECV quantification. Thus, further validation through clinical studies is necessary. Second, our study utilized only the conventional standard image reconstruction filter. In recent years, advancements in deep-learning-based image reconstruction methods have emerged, and applying these innovative techniques to PCD-CT may further enhance the accuracy of ECV quantification. Third, our study solely focused on evaluating ECV quantification using CT numbers and did not validate methods reliant on iodine density. Conducting foundational research is important before considering the adoption of ECV quantification derived from iodine density to ascertain the accuracy of iodine density quantification through PCD-CT. Finally, PCD-CT scanners from other vendors use different detector systems, potentially causing variations from the outcomes obtained with our prototype PCD-CT scanner.
CONCLUSION
Establishing suitable keV and radiation dose parameters is imperative when quantifying ECV with PCD-CT, as varying keV levels could cause disparities in quantification values and measurement fluctuations. This prototype PCD-CT scanner facilitated precise ECV quantification at 50 and 60 keV with 150- and 300 mAs settings.
Ethical approval
The ethical approval for this study is not required as it is a phantom study.
Declaration of patient consent
Patient’s consent is not required as there are no patients in this study.
Conflicts of interest
SK, KY, IT, YA, TG, KT, and FT are employees of FUJIFILM Corporation. The remaining authors have no conflicts of interest.
Use of artificial intelligence (AI)-assisted technology for manuscript preparation
The authors confirm that there was no use of artificial intelligence (AI)-assisted technology for assisting in the writing or editing of the manuscript and no images were manipulated using AI.
Financial support and sponsorship
SO and YF report receiving research grants from FUJIFILM Corporation.
References
- Association of myocardial fibrosis and cardiovascular events: The multi-ethnic study of atherosclerosis. Eur Heart J Cardiovasc Imaging. 2019;20:168-76.
- [CrossRef] [PubMed] [Google Scholar]
- Association of fibrosis with mortality and sudden cardiac death in patients with nonischemic dilated cardiomyopathy. JAMA. 2013;309:896-908.
- [CrossRef] [Google Scholar]
- Assessment of myocardial fibrosis with cardiovascular magnetic resonance. J Am Coll Cardiol. 2011;57:891-903.
- [CrossRef] [PubMed] [Google Scholar]
- Multimodality imaging assessment of myocardial fibrosis. JACC Cardiovasc Imaging. 2021;14:2457-69.
- [CrossRef] [PubMed] [Google Scholar]
- Clinical recommendations for cardiovascular magnetic resonance mapping of T1, T2, T2* and extracellular volume: A consensus statement by the Society for Cardiovascular Magnetic Resonance (SCMR) endorsed by the European Association for Cardiovascular Imaging (EACVI) J Cardiovasc Magn Reson. 2017;19:75.
- [CrossRef] [PubMed] [Google Scholar]
- Cardiac magnetic resonance T1 mapping. Part 2: Diagnostic potential and applications. Eur J Radiol. 2018;109:235-47.
- [CrossRef] [PubMed] [Google Scholar]
- Clinical utility of coronary artery computed tomography angiography-What we know and What's new? Prog Cardiovasc Dis. 2022;75:12-20.
- [CrossRef] [PubMed] [Google Scholar]
- Computed tomography imaging in the context of transcatheter aortic valve implantation (TAVI)/transcatheter aortic valve replacement (TAVR): An expert consensus document of the society of cardiovascular computed tomography. J Cardiovasc Comput Tomogr. 2019;13:1-20.
- [CrossRef] [PubMed] [Google Scholar]
- Myocardial late enhancement and extracellular volume with single-energy, dual-energy, and photon-counting computed tomography. J Cardiovasc Comput Tomogr. 2024;18:3-10.
- [CrossRef] [PubMed] [Google Scholar]
- Cardiac computed tomography for quantification of myocardial extracellular volume fraction: A systematic review and meta-analysis. JACC Cardiovasc Imaging. 2023;16:1306-17.
- [CrossRef] [PubMed] [Google Scholar]
- CT for the evaluation of myocardial extracellular volume with MRI as reference: A systematic review and meta-analysis. Eur Radiol. 2023;33:8464-76.
- [CrossRef] [PubMed] [Google Scholar]
- Interstitial myocardial fibrosis assessed as extracellular volume fraction with low-radiation-dose cardiac CT. Radiology. 2012;264:876-83.
- [CrossRef] [PubMed] [Google Scholar]
- Measurement of myocardial extracellular volume fraction by using equilibrium contrast-enhanced CT: Validation against histologic findings. Radiology. 2013;269:396-403.
- [CrossRef] [PubMed] [Google Scholar]
- Multidetector CT measurement of myocardial extracellular volume in acute patchy and contiguous infarction: Validation with microscopic measurement. Radiology. 2015;274:370-8.
- [CrossRef] [PubMed] [Google Scholar]
- Myocardial extracellular volume fraction with dual-energy equilibrium contrast-enhanced cardiac CT in nonischemic cardiomyopathy: A prospective comparison with cardiac MR imaging. Radiology. 2016;280:49-57.
- [CrossRef] [PubMed] [Google Scholar]
- Myocardial extracellular volume fraction to differentiate healthy from cardiomyopathic myocardium using dual-source dual-energy CT. J Cardiovasc Comput Tomogr. 2020;14:162-7.
- [CrossRef] [PubMed] [Google Scholar]
- Myocardial late iodine enhancement and extracellular volume quantification with dual-layer spectral detector dual-energy cardiac CT. Radiol Cardiothorac Imaging. 2019;1:e180003.
- [CrossRef] [PubMed] [Google Scholar]
- First clinical photon-counting detector CT system: Technical evaluation. Radiology. 2022;303:130-8.
- [CrossRef] [PubMed] [Google Scholar]
- Photon-counting CT: Technical principles and clinical prospects. Radiology. 2018;289:293-312.
- [CrossRef] [PubMed] [Google Scholar]
- Review of technical advancements and clinical applications of photon-counting computed tomography in imaging of the thorax. J Thorac Imaging. 2021;36:84-94.
- [CrossRef] [PubMed] [Google Scholar]
- Clinical applications of photon counting detector CT. Eur Radiol. 2023;33:5309-20.
- [CrossRef] [Google Scholar]
- Coronary CT angiography with photon-counting CT: First-in-human results. Radiology. 2022;303:303-13.
- [CrossRef] [PubMed] [Google Scholar]
- Spectral photon-counting CT in cardiovascular imaging. J Cardiovasc Comput Tomogr. 2021;15:218-25.
- [CrossRef] [PubMed] [Google Scholar]
- Dual-source photon-counting computed tomography-part I: Clinical overview of cardiac CT and coronary CT angiography applications. J Clin Med. 2023;12:3627.
- [CrossRef] [PubMed] [Google Scholar]
- Myocardial characterization with extracellular volume mapping with a first-generation photon-counting detector CT with MRI reference. Radiology. 2023;307:e222030.
- [CrossRef] [PubMed] [Google Scholar]
- Effect of image quality on myocardial extracellular volume quantification using cardiac computed tomography: A phantom study. Acta Radiol. 2022;63:159-65.
- [CrossRef] [PubMed] [Google Scholar]
- Deep learning image reconstruction for CT: Technical principles and clinical prospects. Radiology. 2023;306:e221257.
- [CrossRef] [PubMed] [Google Scholar]
- Extracellular volume quantification with cardiac late enhancement scanning using dual-source photon-counting detector CT. Invest Radiol. 2022;57:406-11.
- [CrossRef] [PubMed] [Google Scholar]