Translate this page into:
Assessment of Ischemic Cardiomyopathy Using Cardiovascular Magnetic Resonance Imaging: A Pictorial Review
Address for correspondence: Dr. Cristina Ivette Olivas-Chacon, 4800 Alberta Avenue, El Paso, Texas - 79905, USA. E-mail: cristina.olivas@ttuhsc.edu
-
Received: ,
Accepted: ,
This is an open-access article distributed under the terms of the Creative Commons Attribution License, which permits unrestricted use, distribution, and reproduction in any medium, provided the original author and source are credited.
This article was originally published by Medknow Publications & Media Pvt Ltd and was migrated to Scientific Scholar after the change of Publisher.
Abstract
Ischemic heart disease is the leading cause of death worldwide. In the last two decades, cardiovascular magnetic resonance imaging (CMRI) has emerged as the primary imaging tool in the detection and prognostic assessment of ischemic heart disease. In a single study, CMRI allows evaluation of not only myocardial wall perfusion, but also the presence, acuity, and extent of myocardial ischemia and infarction complications. Also, rest and stress perfusion imaging can accurately depict inducible ischemia secondary to significant coronary artery stenosis. We present a pictorial review of the assessment of ischemic cardiomyopathy with an emphasis on CMRI features.
Keywords
Delayed gadolinium enhancement
ischemia
steady-state free precession
viability

INTRODUCTION

The development of ischemic cardiomyopathy is a time-dependent phenomenon. Atherosclerotic narrowing of a culprit coronary artery results in exhaustion of vascular compensatory mechanisms, eventually leading to myocyte hypoxia and metabolite buildup.[1] The inadequately supplied myocardial cells become necrotic and eventually are replaced by fibrosis.
Cardiovascular magnetic resonance imaging (CMRI) is a comprehensive and accurate imaging tool in the assessment and therapeutic approach of ischemic cardiomyopathy. Using paramagnetic contrast agents, CMRI allows evaluation of ventricular function, myocardial rest and stress perfusion, and irreversible myocardial injury in a single study without exposure to ionizing radiation.[2]
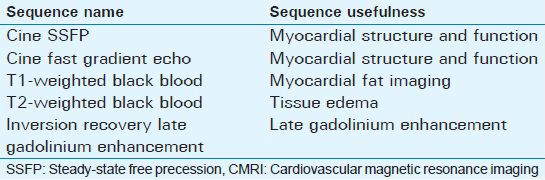
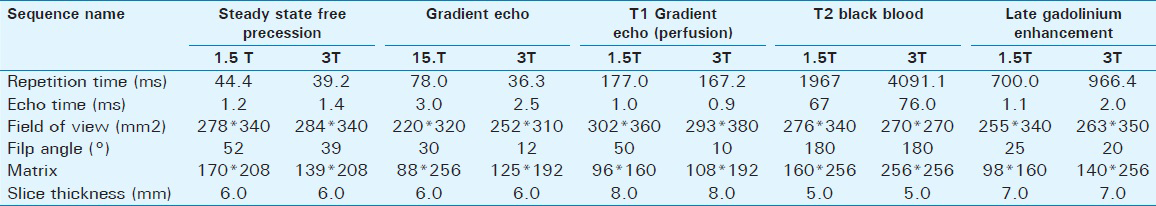
Usefulness and parameters of the commonly used CMRI sequences in the evaluation of ischemic cardiomyopathies are summarized in Tables 1 and 2.
Limitations of CMRI include reduced image quality in patients with significant dyspnea or arrhythmia. Relative contraindications include implantable devices such as pacemakers or automatic implantable cardioverter defibrillators. Severe renal failure (stage 4 or 5; GFR <30 mL/min/1.73 m2) is a contraindication to contrast enhanced CMRI due to the risk of nephrogenic systemic fibrosis after gadolinium-based contrast agent administration.[3]
Ventricular function
CMRI is the current reference standard for the assessment of myocardial ventricular volume and function; it has less inter-observer variability, better spatial and temporal resolution, and superior ability to delineate the endocardial borders than echocardiography and nuclear imaging. ECG gated cine imaging allows the evaluation of ejection fraction (EF), wall motion abnormalities, and changes in myocardial thickness during the cardiac cycle.[2]
The acute manifestation of myocardial ischemia is the impairment of regional myocardial contractility in the vascular territory of the culprit vessel leading to decreased left ventricular ejection fraction (LVEF) with no immediate definite abnormalities noted on LGE. Without prompt restoration of arterial blood flow, myocardial edema, necrosis, and scaring result in changes on LGE within the perfusion territory. On cine imaging, chronic ischemic cardiomyopathy appears as abnormal regional contractility corresponding to a zone of scarring with abnormal late gadolinium enhancement (LGE) [Video 1].
Wall motion abnormalities include hypokinesis (decreased motion), akinesis (absent motion), and dyskinesis (paradoxical motion). Normally the left ventricular (LV) free wall thickness increases more than 30% during systole.
With steady-state free precession (SSFP) cine imaging, hypokinesis is visualized as systolic wall thickening between 10 and 30%, akinesis as systolic wall thickening less than 10%, and dyskinesis as paradoxical outward systolic motion with associated myocardial thinning [Video 2, Figures 1 and 2].[4]
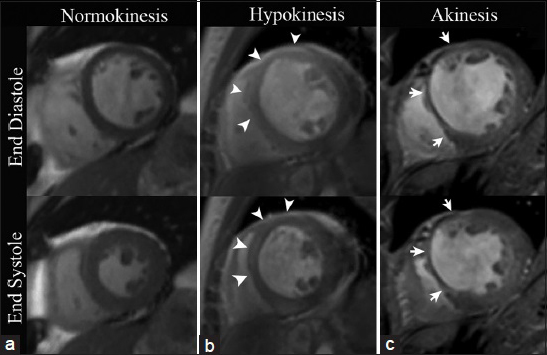
- CMRI SSFP with mid-ventricle short axis views in three different patients. (a) 58-year-old healthy female demonstrates a uniform increase in myocardial wall thickness greater than 30% during systole. (b) 46-year-old male with a previous infarct in the left anterior descending (LAD) coronary artery distribution displays less than 30% of systolic myocardial wall thickening in the mid-anterior and anteroseptal wall (arrowheads), exemplifying hypokinesis. (c) 68-year-old female with a remote myocardial infarction in the LAD coronary artery territory shows less than 10% systolic increase in myocardial wall thickening in the anterior and anteroseptal wall illustrating a case of focal akinesis (arrows).
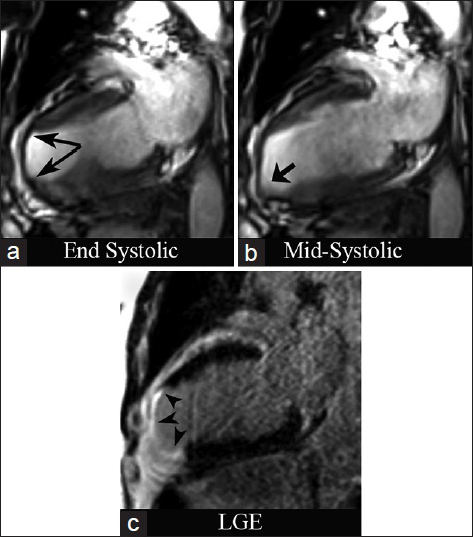
- 74-year-old male with stable angina diagnosed with chronic ischemic cardiomyopathy and LV aneurysm. CMRI with two-chamber views. SSFP at end systole (a) demonstrates severe LV wall thinning in the apex and apical anterior wall (long arrows). (b) Mid-systolic apical bulging (short arrow). (c) Inversion recovery delayed enhancement (DEIR) imaging demonstrates transmural enhancement of the apex, apical anterior, and apical inferior wall (arrowheads), matching the regions of myocardial wall thinning and dyskinesis.
Viability
Acute myocardial necrosis results in an increased interstitial distribution volume for gadolinium due to cellular membrane rupture and edema. In the later phase of myocardial infarction (MI), myocardial scars retain the contrast agent longer than the normal myocardium due to different wash-in and wash-out kinetics. The net result of both mechanisms is that infarcted non-viable myocardium appears bright on LGE-T1-weighted images.
Using inversion recovery techniques, the signal intensity of viable non-infarcted myocardium can be artificially nulled at a specific inversion time (TI) in order to maximize its contrast when compared with hypertintense gadolinium-retaining infarcted tissue [Figure 3].[5]

- The optimal inversion time (TI) (347 ms for this patient) is selected using multiple single-shot scout images at varying TI to visually select the TI values that maximize late enhancing tissue contrast (arrowhead). By obtaining images at the null point of normal myocardium (0 value in the magnetization axis pointed by dashed line), the contrast between myocardial areas of LGE (blue line) and normal myocardium (red line) is optimized.
The subendocardial myocardium is the most vulnerable region to ischemia due to the nature of its end point blood supply; therefore, LGE is seen initially in the subendocardium, extending toward the epicardium if the vascular occlusion persists. The pattern of subendocardial or transmural LGE located within the perfusion territory of an epicardial coronary artery is consistent with infarcted tissue.
Abnormal subendocardial enhancement can also be visualized in non-ischemic cardiomyopathies including amyloidosis and Loeffler endocarditis, differentiating them from ischemic causes as they usually do not occur in a coronary artery distribution.[6].
In patients with surgical ventricle restoration due to post-ischemic akinetic dilation, an atypical LGE pattern has been described in the surgical site involving the mesocardium and subepicardium while sparing the subendocardium.[7]
The transmural extent of myocardial infarct affects the likelihood of functional recovery after successful revascularization and predicts post-revascularization mortality. LGE involving more than 50% of the myocardial wall thickness is considered transmural and functional recovery after bypass grafting in these cases is unlikely [Figure 4], while LGE involving less than 50% of the myocardial thickness is considered subendocardic and has been associated with a better prognosis after revascularization.[6]
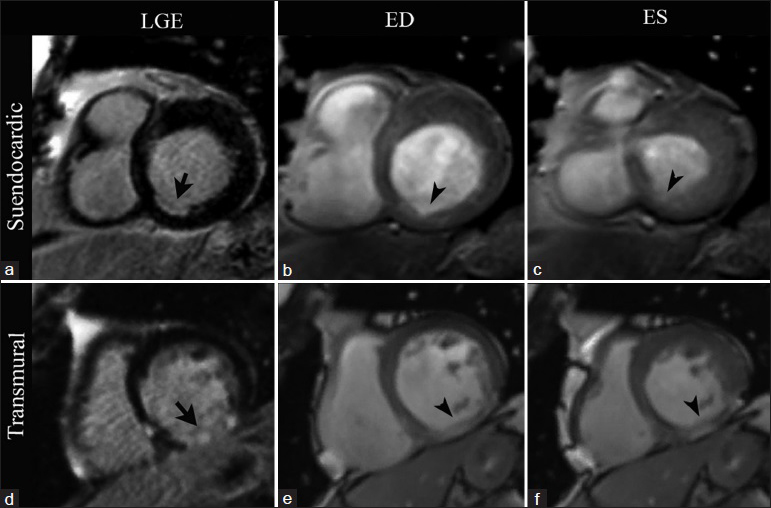
- CMRI short-axis views at the level of the cardiac base in two different patients. First row: 72-year-old patient with stable chronic ischemic cardiomyopathy. LGE imaging (a) demonstrates subendocardial enhancement involving less than 50% of the wall thickness in the basal inferoseptal wall (arrow). SSFP imaging at end diastole (b) and end systole (c) show an area of hypokinesis matching the area of abnormal enhancement (arrowheads). Second row: 61-year-old patient with history of a remote infarct in the right coronary artery distribution. LGE imaging (d) demonstrates a pattern of transmural LGE involving nearly 100% of the myocardium in the basal inferior wall (arrow). A focal area of akinesis matching the region of transmural LGE is seen with SSFP imaging at end diastole (e) and end systole (f) (arrowheads).
T1 mapping
The role of T1 mapping in the clinical evaluation of ischemic heart disease is evolving. While LGE visualizes pathologic changes in reference to not affected myocardium, T1 mapping has the ability to detect and quantify diffuse fibrotic changes earlier than LGE and without the need of a reference standard. Changes in any region of the heart can be visualized and quantified through T1 mapping by generating a parametric map assigning T1 values to each voxel in the myocardium.
T1 mapping has the ability to not only identify edema, ischemia and replacement fibrosis but also to measure the extent of hypoperfused myocardium as the area at risk.[8]
Hibernating myocardium
Hibernating myocardium undergoes profound reversible cytological changes secondary to chronic hypoperfusion and oxidative metabolism. It retains viability, but exhibits marked contractile dysfunction, which characteristically displays an improvement after revascularization. On cine imaging, the hibernating myocardium appears thinned and hypokinetic without LGE [Figure 5].[9]

- 53-year-old female presenting symptoms of intermittent dyspnea and 81% obstruction of the right coronary (RC) documented by percutaneous angiography. CMRI short-axis views at the level of the mid-ventricle. SSFP cine imaging at end diastole (a) and end systole (b) demonstrates myocardial wall thinning and a focal area of hypokinesis in the inferolateral wall (arrows). A thin area of subendocardial hyperenhancement in seen corresponding to the area with abnormal kinesis with LGE imaging (c).
Acuity characterization
One of the advantages of CMRI is its ability to distinguish between acute and chronic myocardial ischemia. Abnormal contractility and LGE are seen in both acute and chronic myocardial injury; however, on T2-weighted CMRI, myocardial edema is an indication of acute but not chronic injury [Figure 6].[2]
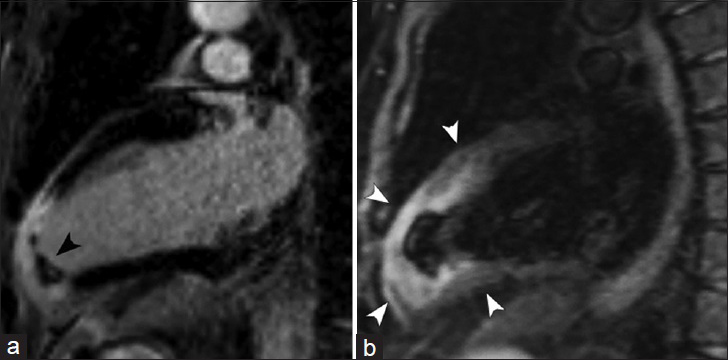
- 63-year-old male presenting with acute chest pain. CMRI two-chamber views. (a) DEIR imaging demonstrates a region of transmural LGE in the apex and apical anterior wall of the left ventricle with an intracavitary thrombus (black arrowhead). (b) T2-weighted Turbo Spin Echo shows increased signal intensity in the regions of abnormal LGE (white arrowheads), representing interstitial edema in the setting of acute myocardial infarction.
Myocardial perfusion
First-pass dynamic imaging using gadolinium-based contrast agents has achieved great clinical prominence in the assessment of myocardial perfusion. Resting perfusion imaging is performed after bolus injection of half a dose (0.05 mmol/kg) of Gd chelate via power injector (4.5–6ml/min) followed by 20 mL of saline.[10] The most vital portion of the acquisition for both visual and quantitative analysis is the initial “first pass” when the contrast agent initially enters and then washes out of the myocardium.[1] On T1-weighted first-pass perfusion imaging, areas of normal myocardium uniformly turn from black (suppressed myocardium) to mid-gray as the contrast agent enters the tissue. Critical stenosis in an epicardial coronary vessel results in a perfusion defect with persistent suppressed myocardium during the first pass of Gd [Figure 7].
- 69-year-old male patient with history of previous myocardial infarction. (a) Short-axis view, phase-sensitive inversion recovery (PSIR) shows transmural LGE of the mid-inferior, inferoseptal, and inferolateral wall (arrows) consistent with myocardial scarring in the RC and left circunflex vascular territories. (b–f) Sequential T1- weighted first-pass perfusion imaging demonstrates a transmural perfusion defect (arrowheads) corresponding to the region of abnormal signal intensity on PSIR imaging.
Cardiac stress testing
Cardiac stress testing allows CMRI to evaluate inducible ischemia through the administration of either catecholamines (dobutamine) or coronary vasodilators (adenosine, dipyridamole, or regadenoson). While dobutamine induces wall motion abnormalities in ischemic areas, vasodilatory stimulants expose myocardial perfusion defects.[1112] Table 3 summarizes the characteristics of pharmacologic agents used at our institution for cardiac stress testing.

Inducible ischemia
The value of vasodilatory stress CMRI in risk classification and clinical prognosis is just emerging. Unless the coronary stenosis is critical, autoregulatory dilation of the distal vessels compensates for reduction in blood flow, ensuring adequate tissue perfusion at rest; however, with increased demand and flow limited by critical stenosis, distal perfusion becomes compromised resulting in myocardial ischemia.[113] First-pass perfusion CMRI during regadenoson coronary vasodilation Figure 6 detects inducible ischemia, appearing as delayed contrast uptake [Video 3, Figure 8].
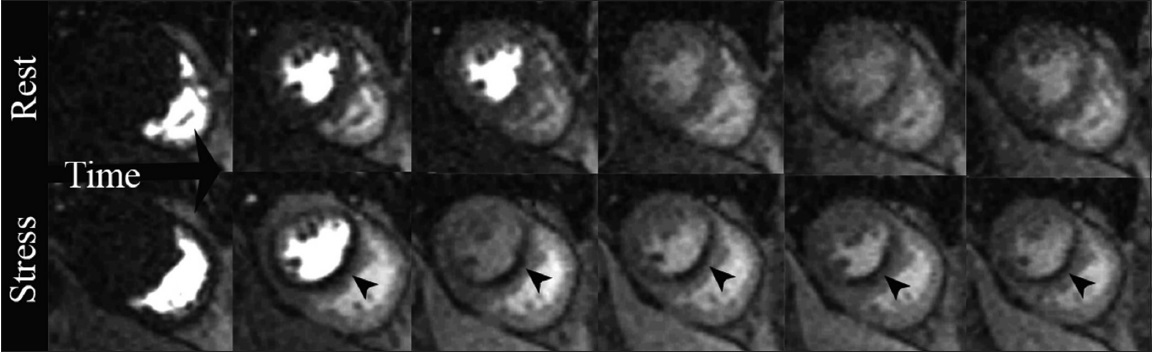
- 66-year-old male with situs inversus, presenting with orthopnea. Positive stress CMRI short-axis views. T1-weighted first-pass perfusion sequential imaging as a bolus of gadolinium contrast transits through the heart: Rest study demonstrates diffuse homogeneous contrast uptake in the myocardium. Stress study obtained two minutes after IV administration of the coronary vasodilator regadenoson, a perfusion defect is noted in the interventricular septum and inferior wall (arrowheads) along the left anterior descending (LAD) and RC vascular territories.
Also, semi-quantitative assessment of myocardial perfusion and estimation of coronary artery perfusion reserve can be achieved by analyzing the signal intensity curves as a function of time during both rest and hyperemia [Figure 9].[10]
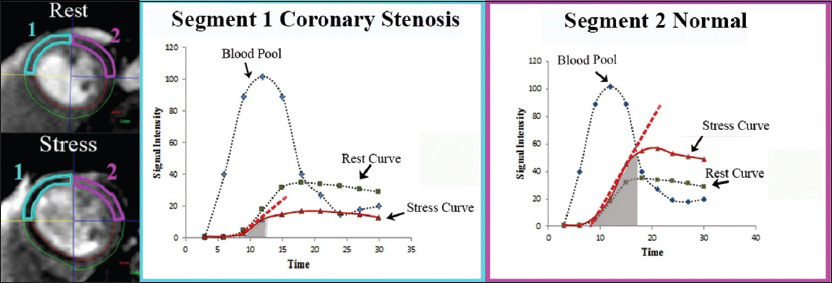
- Graphic representation of signal intensity as a function of time in two myocardial segments labeled 1 (blue) and 2 (pink) during both rest and stress. The dashed red line represents the initial rate of contrast enhancement during stress. The area under the tissue curve (gray shaded area) represents the semi-quantitative parameter to assess perfusion coronary reserve. Inducible ischemia and significantly decreased perfusion reserve during stress can be noted in segment 1 supplied by a stenosed coronary artery, compared with segment 2 supplied by a normal coronary artery.
No-reflow phenomenon
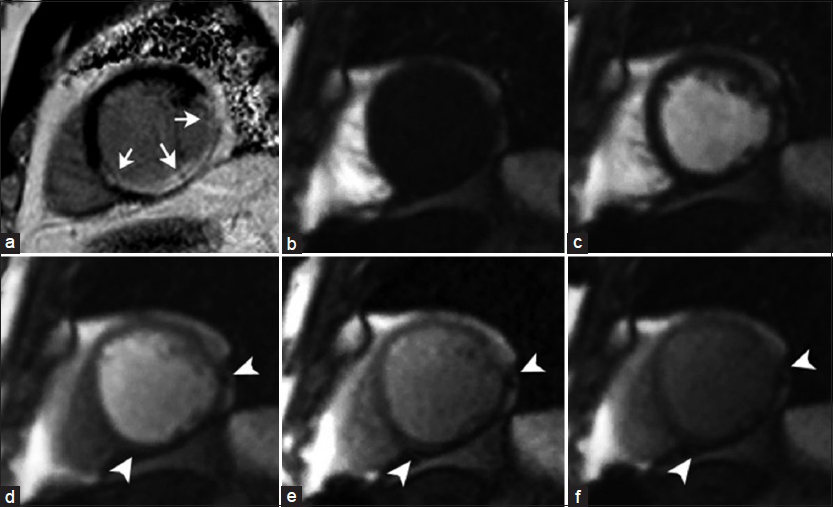
Microvascular obstruction (MVO) occurs in severe acute infarctions, leading to necrosis of not only the myocytes but also the blood vessels resulting in a poorer clinical prognosis given that revascularization of the epicardial vessels will not restore blood flow to the necrosed myocardium.[14] With LGE imaging, a central core of low signal intensity represents a zone of no-reflow surrounded by the typical bright infarct zone, indicating the inability of the contrast agent to penetrate to the central myocardial tissue due to reduced functional capillary density [Figure 10].
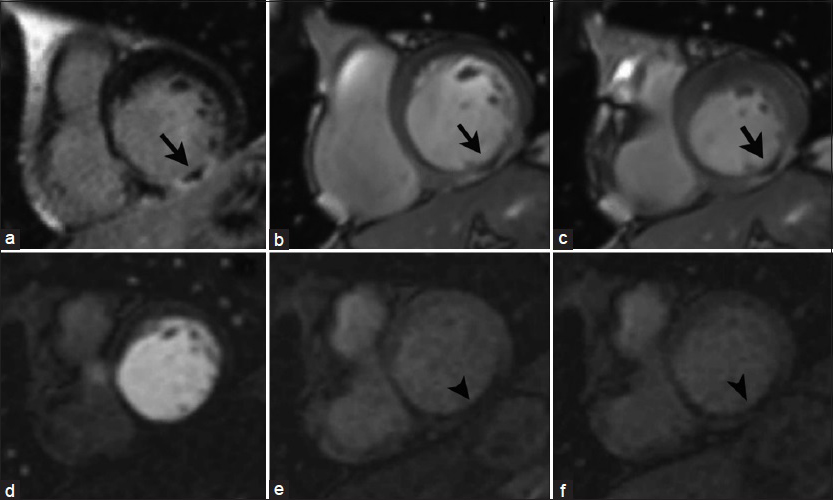
- 65-year-old male with history of previous myocardial infarction secondary to RC artery occlusion. Short-axis views at the level of the cardiac base: DEIR imaging (a) demonstrates a central core of low signal intensity surrounded by a zone of LGE (infarct) in the basal inferior wall of the LV (arrow). Cine SSFP imaging at end diastole (b) and end systole (c) shows focal LV akinesis matching the zone of abnormal enhancement. Serial T1-weighted first-pass perfusion imaging (d–f) reveals a perfusion_defect in the corresponding area (arrowheads), _ consistent with microvascular obstruction in a no-reflow zone.
Myocardial infarction complications
Thrombus
Left ventricular thrombus is a common complication of myocardial infarction, which may lead to arterial embolic events such as stroke, most commonly seen in patients with large anterior MIs, and anteroapical aneurysm formation.[15]
On cine imaging, a thrombus is shown as an intracavitary mass contiguous with an akinetic LV apex [Video 4]. Contrast-enhanced inversion recovery sequences has the ability to differentiate an intracavitary thrombus from cardiac tumors with high accuracy. Using long inversion times (TI-value >422 ms), imaging is performed immediately after administration of gadolinium and following a 15 minute window. While a thrombus consistently demonstrates a characteristic pattern of hypointensity within the core lesion at both points in time, the core lesion of hyper-and hypovascularized tumors appears hyperintense after 15 minutes [Figure 11].[16]
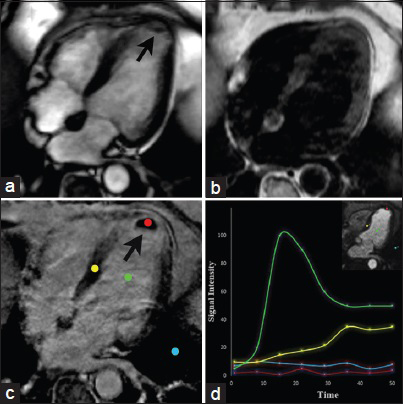
- 64-year-old male with chest pain and an intracavitary mass found on echocardiography. CMRI long horizontal axis (four-chamber) views. SSFP (a) demonstrates an intracavitary mass in the apex of the left ventricle (arrow). T1-weighted imaging (b) shows the lesion appearing isointense to the myocardium. DEIR (c) shows lack of enhancement of the mass abutting an area of transmural LGE in the apex in the LAD artery distribution. Graphic representation of dynamic enhancement (d) demonstrates absence of contrast enhancement in the lesion core (red) when compared with the blood pool (green) and normal myocardium (yellow) consistent with a thrombus due to myocardial infarction.
LV aneurysm
LV aneurysm is a rare complication of myocardial infarction; however, it is associated with significant morbidity and mortality. On cine imaging in the setting of a large infarct, an LV true aneurysm appears as a well-delineated bulge of the myocardial wall, which is dyskinetic in systole, appearing thin and devoid of muscle [Video 5, Figure 12]. Impaired LV function is due to paradoxical expansion and loss of effective contraction.[17] With DEIR imaging, the wall of the aneurysm demonstrates transmural LGE representing a scarred fibrotic wall containing necrotic muscle [Figure 12].

- 74-year-old male presenting with symptoms of cardiogenic shock diagnosed with an LV aneurysm. CMRI with three-chamber views. DEIR (a) shows transmural LGE of the mid-ventricular and apical interventricular septum, right ventricular apex, and LV apex (black arrow). SSFP imaging (b) shows an out-pouching of the anteroseptal wall which is dyskinetic during systole (black arrow). SSFP imaging (c and d) with short-axis views demonstrate the interventricular septal wall bulging outward into the right ventricle (white arrow). ES=End systole ED=End diastole.
CONCLUSION
CMRI effectively allows the combined noninvasive assessment of LV function, myocardial perfusion, and viability. Due to its multimodal data, CMRI provides valuable information in the detection, differential diagnosis, and prognosis of ischemic cardiomyopathy and serves as a valuable complementing imaging tool.
Videos available on www.clinicalimagingscience.org
Available FREE in open access from: http://www.clinicalimagingscience.org/text.asp?2015/5/1/28/157604
Source of Support: Nil
Conflict of Interest: None declared.
REFERENCES
- Cardiac MRI for myocardial ischemia. Methodist Debakey Cardiovasc J. 2013;9:123-31.
- [Google Scholar]
- Ischemic heart disease: A comprehensive evaluation using cardiovascular magnetic resonance. Medicina (Kaunas). 2013;49:97-110.
- [Google Scholar]
- What nephrologists need to know about Gadolinium. Nat Clin Pract Nephr. 2007;3(12):654-668.
- [Google Scholar]
- Correlation between regional wall motion abnormalities via 2-dimensional echocardiography, and coronary angiographic findings. IP MJ. 2012;11(Suppl):630-4.
- [Google Scholar]
- Role of cardiac magnetic resonance imaging in the assessment of myocardial viability. Circulation. 2004;109:1328-34.
- [Google Scholar]
- A pattern-based approach to assessment of delayed enhancement in nonischemic cardiomyopathy at MR imaging. Radiographics. 2009;21:89-103.
- [Google Scholar]
- Atypical myocardial delayed enhancement after surgical ventricle restoration. Eur J Radiol. 2012;81:e292-297.
- [Google Scholar]
- Myocardial T1-Mapping: Techniques and Clinical Applications. Clinic Cardiovasc Imag. 2012;1:96-102.
- [Google Scholar]
- Serial changes in response of hibernating myocardium to inotropic stimulation after revascularization: A dobutamine echocardiographic study. J Am Coll Cardiol. 1997;30:1233-40.
- [Google Scholar]
- Noninvasive Assessment of Myocardial Perfusion. Circ Cardiovasc Imaging. 2009;2:412-424.
- [Google Scholar]
- Myocardial first-pass perfusion cardiovascular magnetic resonance: History, theory, and current state of the art. JCMR. 2008;10:1-18.
- [Google Scholar]
- Dobutamine stress magnetic resonance imaging for detection of coronary artery disease. J Am Coll Cardiol. 1993;22:431-9.
- [Google Scholar]
- Canadian Society for CMR. Canadian Society for Cardiovascular Magnetic Resonance (CanSCMR) recommendations for cardiovascular magnetic resonance image analysis and reporting. Can J Cardiol. 2013;29:260-5.
- [Google Scholar]
- ‘No-reflow’ after acute myocardial infarction: Direct visualisation of microvascular obstruction by gadolinium-enhanced CMR. Neth Heart J. 2008;16:179-81.
- [Google Scholar]
- MR imaging of cardiac tumors and masses: A review of methods and clinical applications. Radiology. 2013;268:26-43.
- [Google Scholar]
- Value of CMR for the Differential Diagnosis of Cardiac Masses. JACC. ;7(9):896-905.
- [Google Scholar]
- Left ventricular true and false aneurysms identified by cardiovascular magnetic resonance. Br J Radiol. 2011;84:e35-7.
- [Google Scholar]