Translate this page into:
Assessment of the Agreement between Cerebral Hemodynamic Indices Quantified Using Dynamic Susceptibility Contrast and Dynamic Contrast-enhanced Perfusion Magnetic Resonance Imagings
-
Received: ,
Accepted: ,
This is an open access article distributed under the terms of the Creative Commons Attribution-NonCommercial-ShareAlike 3.0 License, which allows others to remix, tweak, and build upon the work non-commercially, as long as the author is credited and the new creations are licensed under the identical terms.
This article was originally published by Medknow Publications & Media Pvt Ltd and was migrated to Scientific Scholar after the change of Publisher.
Abstract
Background:
Brain tumor is one of the most common tumors. A successful treatment might be achieved with an early identification. Pathological investigation as the gold standard method for tumor identification has some limitations. Noninvasive assessment of tumor specifications may be possible using perfusion-weighted magnetic resonance imaging (MRI). Cerebral blood volume (CBV) and cerebral blood flow (CBF) could be calculated based on dynamic contrast-enhanced MRI (DCE-MRI) in addition to dynamic susceptibility contrast MRI (DSC-MRI) modality. Each category of the cerebral hemodynamic and permeability indices revealed the specific tumor characteristics and their collection could help for better identification of the tumor. Some mathematical methods were developed to determine both cerebral hemodynamic and permeability indices based on a single-dose DCE perfusion MRI. There are only a few studies available on the comparison of DSC- and DCE-derived cerebral hemodynamic indices such as CBF and CBV.
Aim:
The objective of the study was to validate first-pass perfusion parameters derived from T1-based DCE method in comparison to the routine T2*-based DSC protocol.
Materials and Methods:
Twenty-nine patients with brain tumor underwent DCE- and DSC-MRIs to evaluate the agreement between DSC- and DCE-derived cerebral hemodynamic parameters. Agreement between DSC- and DCE-derived cerebral hemodynamic indices was determined using the statistical method described by Bland and Altman. The reliability between DSC- and DCE-derived cerebral hemodynamic indices was measured using the intraclass correlation analysis.
Results:
The achieved magnitudes for DCE-derived CBV (gray matter [GM]: 5.01 ± 1.40 mL/100 g vs. white matter [WM]: 1.84 ± 0.74 mL/100 g) and DCE-derived CBF (GM: 60.53 ± 12.70 mL/100 g/min vs. WM: 32.00 ± 6.00 mL/100 g/min) were in good agreement with other studies. The intraclass correlation coefficients showed that the cerebral hemodynamic indices could accurately be estimated based on the DCE-MRI using a single-compartment model (>0.87), and DCE-derived cerebral hemodynamic indices are significantly similar to the magnitudes achieved based on the DSC-MRI (P < 0.001). Furthermore, an acceptable agreement was observed between DSC- and DCE-derived cerebral hemodynamic indices.
Conclusion:
Based on the measurement of the cerebral hemodynamic and blood–brain barrier permeability using DCE-MRI, a more comprehensive collection of the physiological parameters cloud be achieved for tumor evaluations.
Keywords
Bland and Altman analysis
brain tumor
cerebral hemodynamic indices
dynamic contrast-enhanced-magnetic resonance imaging
dynamic susceptibility contrast-magnetic resonance imaging
intraclass correlation coefficient


INTRODUCTION
Brain tumor is one of the most common tumors in the world. The primary incidence of the central nervous system (CNS) tumors is approximately 7 people per 100,000 in adults.[1] Studies show that the outbreaks of the disease are 6.04 and 3–5 per 100,000 population/year in the USA and Europe, respectively.[23] Most brain tumors are asymptomatic in the early stages of their progression. Symptoms and deadly characteristics appear in the final stages. Therefore, a successful treatment might be achieved with an early identification.
Histopathological investigation is the gold standard method for tumor identification. The main limitations of the histopathology-based tumor evaluation include inherent sampling errors associated with stereotactic biopsy, limited number of sampling, and the inability to evaluate residual tumor tissues after cytoreductive surgery. In cytoreductive surgery, the histological examination could only be performed on the resected specimens and remaining tumor tissues could not be evaluated.[4] Magnetic resonance imaging (MRI) method is a promising noninvasive method for tumor assessment. In the evaluation of brain tumors using MRI methods, metabolic and physiological changes of the peripheral tissues could be examined in addition to the abnormal sites. Conventional MRI method does not provide reliable information about the tumor physiology including microvascularity, angiogenesis, metabolism, micronecrosis, and cellularity (parameters that are important to determine tumor specifications).[5] Advanced MRI methods provide a comprehensive dataset from in vivo physiological and metabolic information that could complement the histopathology examinations.[6]
Noninvasive assessment of tumor hemodynamic characteristics (before surgery) is possible using perfusion MRI methods.[7] Angiogenesis as the main feature of tumor malignancy is a critical procedure in the solid tumor growth and cancer cell metastasis.[8] First-pass T *2 dynamic susceptibility contrast (DSC) MRI method is considered as the most powerful tool to evaluate tumor vascularity, which is known to be a clinical index for tumor grading and treatment response evaluation.[9]
Dynamic contrast-enhanced MRI (DCE-MRI) is the standard imaging modality to evaluate cerebral hemodynamic and permeability parameters, which provide additional pathological information for preoperative identification of the tumor. Each category of DSC and DCE indices revealed some specific tumor characteristics and their collection could help for better tumor identification and grading.[91011]
Both imaging sequences could be implemented using the dual dynamic acquisition mode with a single-dose contrast administration, which is accessible only in the new MRI systems. However, this technique is not implemented in all available commercial scanners.
Although T*2-based MRI methods such as DSC is faster (about 2 min) and provides higher temporal resolution in comparison to T1-based methods (i.e., DCE), DCE-MRI has its own advantages such as lower susceptibility artifacts and an acceptable imaging time.[111213] Recent studies showed that cerebral blood volume (CBV) and cerebral blood flow (CBF) parameters could be calculated using DCE-MRI method.[1415] There is limited evidence to validate DCE-MRI method for deriving cerebral hemodynamic indices such as CBF and CBV for clinical tumor evaluation. In this study, an existing paradigm is re-evaluated to determine cerebral hemodynamic parameters using DCE-MRI, and the results were compared with perfusion parameters derived from DSC-MRI protocol. To validate these new DCE-derived parameters (CBF and CBV), our patient data were tested by this technique. We believe if a T1-based perfusion method can fulfill first-pass perfusion parameters as efficient as its inherent capability for permeability measurements, then more physiological characteristics of the tumors could be obtained using a single-dose DCE examination.
Theory
To calculate the physiological parameters based on DCE-MRI method, signal intensities must be converted to relaxivity changes. Relaxivity changes are directly proportional to the contrast concentration. Cerebral hemodynamic and permeability parameters quantified based on time-concentration curves.
Quantification of cerebral blood volume and cerebral blood flow using dynamic contrast-enhanced-magnetic resonance imaging
As mentioned above, cerebral hemodynamic parameters including CBV and CBF could also be derived based on the DCE-MRI using a single-compartment model. CBV (in mL/100 g) is the volume of blood in a given amount of brain tissue, which is calculated by equation 1.
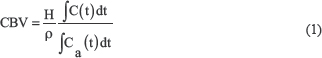
Where C (t) and Ca(t) represent the concentration of the contrast in the tissue and artery at time t, respectively. Brain tissue density (ρ) is set to 1.04 g/mL, and H = (1-Hart)/(1-Hcap) is considered to differentiate capillary hematocrits (Hcap = 25%) from large vessel hematocrits (Har = 45%). Because of normalization to the arterial input function (AIF), the quantified CBV is independent of the injected contrast magnitude.
Determined CBV is the blood volume of the intravascular and leakage space. Corrected CBV reflects only blood volume in the intravascular space. Therefore, corrected CBV would be achieved by the removal of volume contribution of fractional leakage space (equation 2).
CBVcorrected = CBVuncorrected-Ve CBVuncorrected (2)
Cerebral blood flow (CBF) is the volume of blood passing through a defined amount of brain tissue per unit of time (mL/100 g/min). Tissue concentration (C(t)) determined using linear control theory as stated by equation 3:

Where ⊗ is the convolution operator, and R(t) is the residual function. In this study, Fourier transform deconvolution is used to quantifying CBF values.[1516] Using the Fourier transform deconvolution, equation 4 thus becomes:

Where F-1{} denotes the inverse Fourier transformation. CBF could be determined by taking the inverse Fourier transformation of  at every time point with known arterial input and time-concentration curve.
MATERIALS AND METHODS
Imaging protocols
All images were acquired on a 1.5-Tesla clinical MRI scanner (TrioTim, Siemens Medical Solutions, Erlangen, Germany). The precontrast images were obtained using transverse T1-weighted spin echo (repetition time [TR]/ echo time [TE], 370/8.7 msec; flip angle, 90; slice thickness, 5 mm; number of averages, 1; matrix, 512 × 464), transverse T2-weighted spin echo (TR/TE, 3300/99; echo train length, 11; flip angle, 120; slice thickness, 5 mm; number of averages, 2; matrix, 384 × 288), and transverse FLAIR (TR/TE, 5580/92 msec; TI, 1935; flip angle, 150; echo train length, 28; slice thickness, 4 mm; number of averages, 1; matrix, 512 × 512) sequences. For the baseline T1 calculation, four pre-contrast data sets were acquired using a three-dimensional T1-weighted gradient echo sequence with different flip angles (α=2°, 10°, 20°, and 25°). The sequence parameters were as follows: TR=12 ms, TE=3.5 ms, matrix size=256×224, number of excitations (NEX)=1, and slice thickness=5 mm.
Dynamic contrast-enhanced T1-weighted imaging was performed using a gradient recalled echo sequence (GR) with TR = 4.13 ms, TE = 1.54 ms, field of view = 200 × 200 mm2, matrix size = 256 × 224, flip angle = 15°, NEX = 1, slice thickness = 5 mm, number of measurements = 70, and gap = 5 mm. At the sixth acquisition, Gd-DTPA (0.1 mL/kg) was injected intravenously with a rate of 2 mL/second, followed immediately by a bolus injection of 15 mL saline flush at the same rate.
DSC-MRI was performed using a gradient echo-planar pulse sequence with TR = 1860 ms, TE = 45 msec, field of view = 200 × 200 mm2, matrix size = 128 × 116, flip angle = 90°, NEX = 1, slice thickness = 5 mm, number of measurements = 64, and gap = 5 mm. At the sixth acquisition, Gd-DTPA (0.1 mL/kg) was injected intravenously with a rate of 2 mL/second, followed immediately by a bolus injection of 15 mL saline flush at the same rate.
The postcontrast images were obtained using transverse T1-weighted spin-echo sequence with an acquisition protocol similar to that of the precontrast T1-weighted images.
Data analysis
Dynamic contrast-enhanced-magnetic resonance imaging analysis
In preprocessing step, motion correction was performed using FSL software (University of Oxford). MCFLIRT function was used to reduce motion artifacts. After motion correction, the slices of interest were extracted using MATLAB (ver. 2008a, The MathWorks TM, Natick, Massachusetts, United States). Data smoothing was performed using a 3 × 3 mean filter, and a semi-automatic MATLAB code was used for brain extraction.
DCE-MRI data were analyzed using in-house-developed software in MATLAB. The ROIs were determined by mouse pointer-aided method.
Dynamic susceptibility contrast-magnetic resonance imaging analysis
In DSC-MRI method, the relationship between the contrast concentration and the signal intensity is expressed by the following equation:
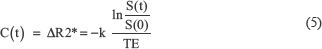
Where C (t) is the contrast concentration at time t, Δ R2 * is T *2 relaxation rate change (=1/T *2) due to contrast injection, S(t) is the signal intensity at time t, TE is echo time, and k is a constant coefficient.
In this method, cerebral hemodynamic parameters included CBF, and CBV quantified using the standard singular value decomposition convolution algorithm. The constant k depends on the tissue, contrast agent, magnetic field strength, and imaging sequence.
Patients
Twenty-nine patients with brain tumors (male-female ratio, 20:9; mean age, 35.52 years; age range, 21–66 years) were scanned to evaluate the agreement between DSC- and DCE-derived cerebral hemodynamic parameters. The patients underwent DSC- and DCE-MRIs. The study was approved by the local committee for medical research ethics. Informed consent was obtained from all of the patients before the study.
Patients’ data were analyzed using the mentioned algorithms. Agreement between DSC- and DCE-derived cerebral hemodynamic parameters was evaluated for tumor and normal gray and white matters. The normal gray and white matters were segmented based on the structural MRIs of the contralateral normal side. The obtained masks were considered as the region of interests (ROIs) and automatically transferred into the parametric maps [Figure 1]. For evaluating of the tumor regions, the corresponding DSC- and DCE-derived cerebral hemodynamic maps were registered, and the ROI was selected on the enhanced area [Figure 1]. The means of the cerebral hemodynamic indices in the ROIs were determined.
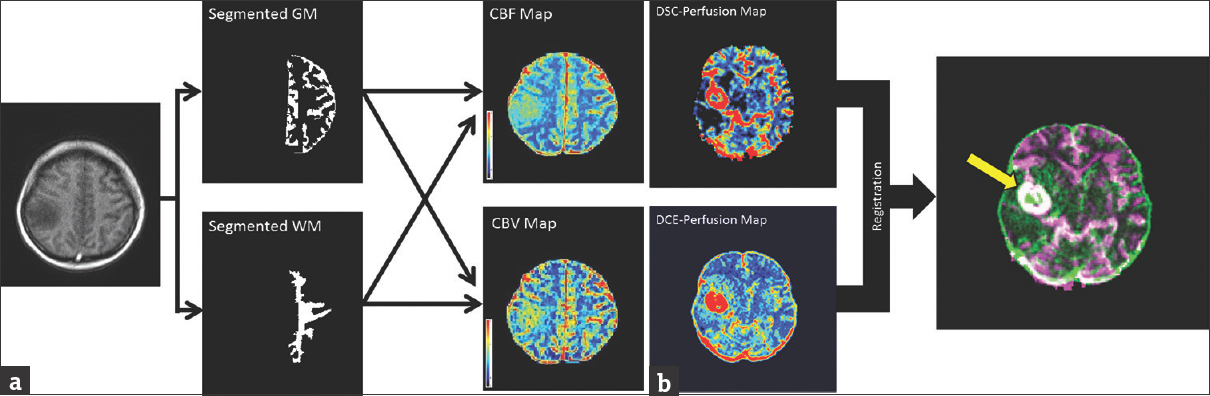
- (a) Graphical presentation of the region of interest selection procedure for normal gray and white matters. The normal gray and white matters were segmented based on the structural magnetic resonance imagings of the contralateral normal side. The obtained masks were considered as the region of interests and automatically transferred into the parametric maps. The means of the cerebral hemodynamic indices in the region of interests were determined. (b) Graphical presentation of the region of interest selection procedure for tumor tissue. The corresponding dynamic susceptibility contrast- and dynamic contrast-enhanced-derived cerebral hemodynamic maps were registered, and the region of interest was selected on the enhanced area. The means of the cerebral hemodynamic indices in the region of interests were determined. The enhanced area is indicated using the yellow arrow in the registered image.
Statistical analysis
Agreement between DSC- and DCE-derived cerebral hemodynamic indices was determined using the statistical method described by Bland and Altman.[17] In this method, a plot of the difference between DSC- and DCE-derived cerebral hemodynamic indices against their mean is used to investigate any possible relationship between the measurement error and the true value. The mean of the two measurements is considered as the true value. The limits of agreement were determined using equation 6:
Limits of agreement = Mean difference ± 1.96 × Standard deviation of the differences (6)
The reliability between DSC- and DCE-derived cerebral hemodynamic indices was determined using the intraclass correlation coefficient (ICC). The intraclass correlation analysis is a popular statistical method to evaluate the agreement between the continuous variables.[18] Data analysis was performed using SPSS 16.0 (SPSS Inc., Chicago, IL).
RESULTS
For evaluation of the accuracy of the proposed method for quantifying the cerebral hemodynamic indices, CBV and CBF were determined by both DSC- and DCE-MRI methods [Figure 2].

- Dynamic susceptibility contrast- and dynamic contrast-enhanced-derived cerebral hemodynamic maps for a 21-year-old man with brain tumor. The region of interest is indicated using the yellow arrow in dynamic susceptibility contrast-derived cerebral blood volume map.
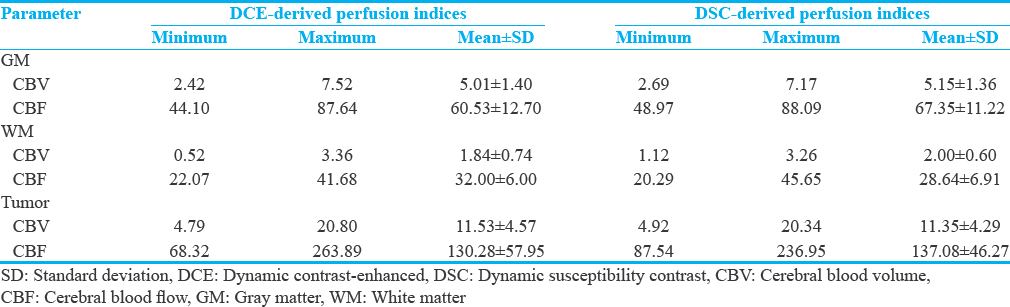
The means and standard deviations of the DCE-derived cerebral hemodynamic indices for normal gray and white matters and the magnitudes reported in other studies are listed in Table 1.

Table 2 summarizes the descriptive statistics of DSC- and DCE-derived cerebral hemodynamic indices for tumor and normal gray and white matters.
The scattergrams of DSC- and DCE-derived cerebral hemodynamic indices for tumor and normal gray and white matters are plotted to evaluate the distribution of these magnitudes [Figure 3].
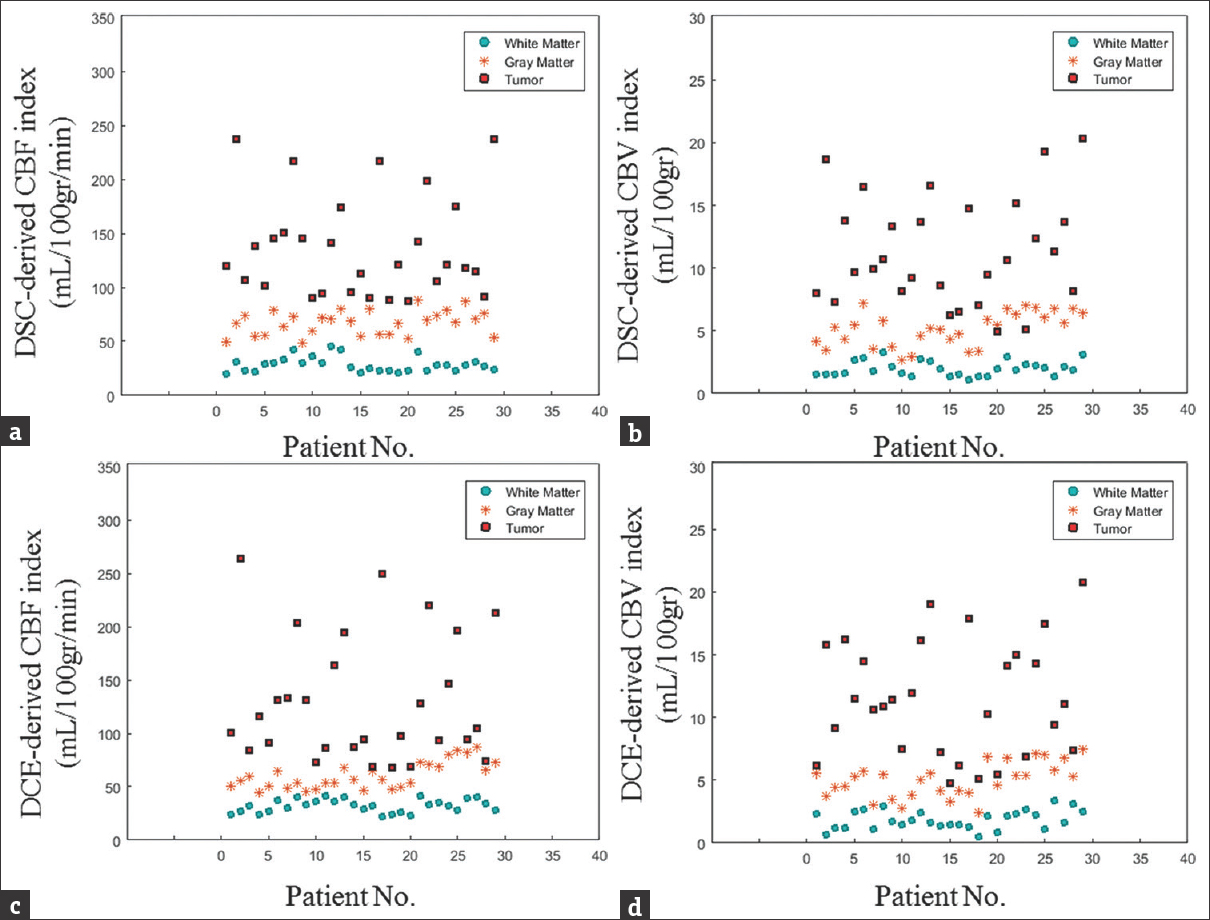
- Scatterplots of dynamic susceptibility contrast- and dynamic contrast-enhanced-derived cerebral hemodynamic indices for tumor and normal gray and white matters. (a) Scatterplot of dynamic susceptibility contrast-derived cerebral blood flow quantities for tumor and normal gray and white matters. (b) Scatterplot of dynamic susceptibility contrast-derived cerebral blood volume quantities for tumor and normal gray and white matters. (c) Scatterplot of dynamic contrast-enhanced-derived cerebral blood flow quantities for tumor and normal gray and white matters. (d) Scatterplot of dynamic contrast-enhanced-derived cerebral blood volume quantities for tumor and normal gray and white matters.
The Bland–Altman plots of DSC- and DCE-derived cerebral hemodynamic indices are illustrated [Figure 4].

- Bland–Altman plots of dynamic susceptibility contrast- and dynamic contrast-enhanced-derived cerebral hemodynamic indices for tumor and normal gray and white matters. (a) Bland–Altman plots of dynamic susceptibility contrast- versus dynamic contrast-enhanced-derived cerebral blood flow for normal gray matter. (b) Bland–Altman plots of dynamic susceptibility contrast- versus dynamic contrast-enhanced-derived cerebral blood volume for normal gray matter. (c) Bland–Altman plots of dynamic susceptibility contrast- versus dynamic contrast-enhanced-derived cerebral blood flow for normal white matter. (d) Bland–Altman plots of dynamic susceptibility contrast- versus dynamic contrast-enhanced-derived cerebral blood volume for normal white matter. (e) Bland–Altman plots of dynamic susceptibility contrast- versus dynamic contrast-enhanced-derived cerebral blood flow for tumor tissues. (f) Bland–Altman plots of dynamic susceptibility contrast- versus dynamic contrast-enhanced-derived cerebral blood volume for tumor tissues. The middle line is the mean difference and the two extreme lines are the limits of agreement.
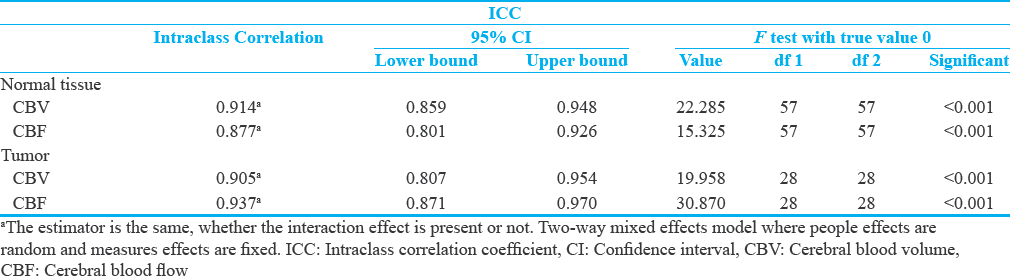
The scatterplots of DSC- and DCE-derived cerebral hemodynamic indices and the equality line are depicted to demonstrate the agreement of the indices [Figure 5]. The intraclass correlation and significant coefficients between DSC- and DCE-derived cerebral hemodynamic indices are listed in Tables 3.
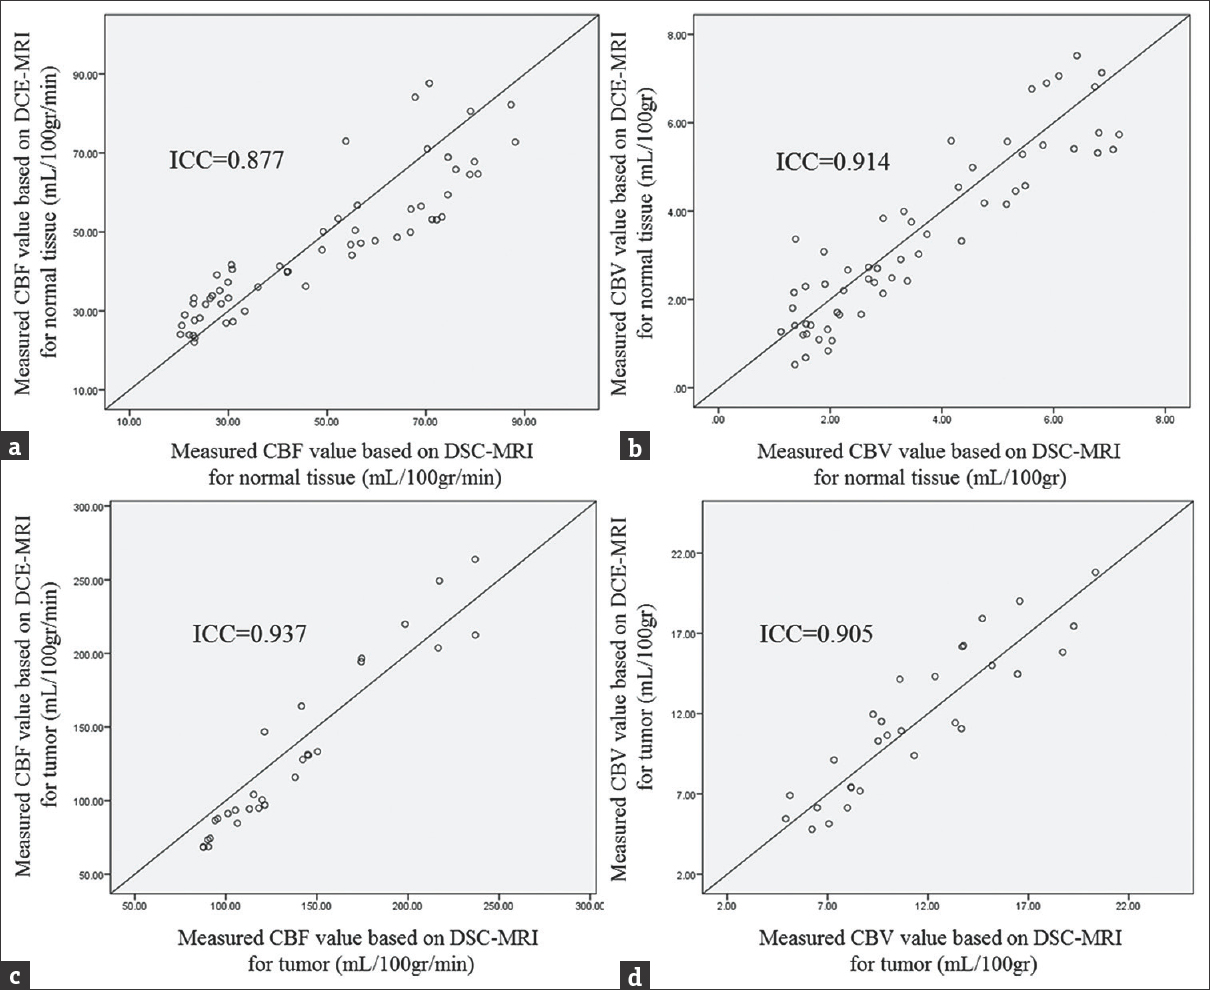
- (a) The scatterplot of dynamic susceptibility contrast- and dynamic contrast-enhanced-derived cerebral blood flow for normal brain tissues. (b) The scatterplot of dynamic susceptibility contrast- and dynamic contrast-enhanced-derived cerebral blood volume for normal brain tissues. (c) The scatterplot of dynamic susceptibility contrast- and dynamic contrast-enhanced-derived cerebral blood flow for tumor tissues. (d) The scatterplot of dynamic susceptibility contrast- and dynamic contrast-enhanced-derived cerebral blood volume for tumor tissues. For each scatterplot, the equality line was plotted to demonstrate the agreement of the indices, and the intraclass correlation coefficient was expressed.
DISCUSSION
In our study, DCE-derived CBF magnitudes for normal gray and white matters were 60.53 ± 12.70 mL/100 g/min and 32.00 ± 6.00 mL/100 g/min, respectively. DCE-derived CBV quantities for normal gray and white matters were 5.01 ± 1.40 mL/100 gr and 1.84 ± 0.74 mL/100 gr, respectively. There were statistically significant differences for the DCE-derived cerebral hemodynamic indices between the normal gray and white matters (P < 0.001), which were correlating with the known increased vascularity of gray matter. DCE-derived cerebral hemodynamic indices of the normal gray and white matters were in good agreement with other studies.[1415192021222324] CBV and CBF of the tumor tissues were considerably higher than that of the normal gray and white matters [Figure 3]. There were statistically significant differences for CBV and CBF indices between the tumor and normal tissues (P < 0.001).
Concurrent estimation of cerebral perfusion, blood volume, and blood–brain barrier permeability using DCE-MRI was evaluated by Larsson et al.[13] and Sourbron et al.[14]
Cerebral hemodynamic indices were quantified based on the DCE-MRI data, a method similar to our study. However, the correlation and agreement of these data with the quantified magnitudes using the DSC-MRI were not evaluated.
In this study, Bland–Altman plots showed that the cerebral hemodynamic indices quantified using DCE-MRI data have good agreement with the standard cerebral hemodynamic indices calculated using DSC-MRI data. DSC- and DCE-derived CBV magnitudes were compared by Haroon et al.[25] For normal brain tissues of nine patients with intra-axial tumors, an excellent correlation (r = 0.96, P < 0.001) was achieved using pixel-by-pixel scattergrams of values. Leakage-free T1 CBV maps provide comparable biological information with that of the T2* CBV maps. In Haroon et al. study, the correlation of DSC- and DCE-derived CBV was evaluated for normal brain tissues. The correlation and scattergram of the quantified indices were also studied in tumor area for one patient. The correlation is not a strong statistical analysis to evaluate the agreement between two methods. It seems that a more sophisticated statistical method (such as Bland–Altman analysis) with a larger sample size is needed for determining the agreement between DSC- and DCE-derived cerebral hemodynamic indices.[18]
In our study, the ICCs between DSC- and DCE-derived CBF and between DSC- and DCE-derived CBV for normal brain tissues were 0.877 and 0.914, respectively. The ICCs between DSC- and DCE-derived CBF and between DSC- and DCE-derived CBV for tumor tissues were 0.937 and 0.905, respectively. The ICCs were significant at less than 0.001% level for DSC- and DCE-derived cerebral hemodynamic indices. The ICCs showed that CBV and CBF could accurately be estimated based on the DCE-MRI using a single-compartment model (>0.87), and DCE-derived magnitudes are significantly similar to that of the DSC-MRI technique (P < 0.001). Furthermore, the acceptable agreements were achieved between DSC- and DCE-derived cerebral hemodynamic indices. These results validated the accuracy of the method to quantify CBV and CBF indices.
The cerebral hemodynamic and permeability indices are conventionally quantified based on different perfusion MRI techniques, separately. Both parameter categories could be extracted using single-dose DCE perfusion MRI. DCE-derived cerebral hemodynamic indices could be considered as a promising method to evaluate brain tumors. DCE-MRI permits multiparametric characterization of tumor vasculature which is not affected by susceptibility artifacts.[1113]
CONCLUSION
In this study, the agreement between DSC- and DCE-derived cerebral hemodynamic indices was evaluated for tumoral and normal brain tissues. Cerebral hemodynamic parameters including CBV and CBF were calculated from DCE-MRI data accurately. Based on the proposed method, CBV and CBF could be determined based on the DCE-MRI using a single-compartment model with fair agreement with that of DSC-MRI and a more comprehensive collection of the physiological parameters achieved for tumor evaluations.
Financial support and sponsorship
This research has been supported by Tehran University of Medical Sciences, grant number 94-01-30-27363, 2015/04/19.
Conflicts of interest
There are no conflicts of interest.
Acknowledgment
Authors would like to thank the research affair of Medicine faculty of Tehran University of Medical Sciences, Medical Imaging Center of Imam Khomeini Hospital (Tehran), and participants in the study.
Available FREE in open access from: http://www.clinicalimagingscience.org/text.asp?2018/8/1/2/223734.
REFERENCES
- Current status of local therapy in malignant gliomas – A clinical review of three selected approaches. Pharmacol Ther. 2013;139:341-58.
- [Google Scholar]
- Glioblastoma and other malignant gliomas: A clinical review. JAMA. 2013;310:1842-50.
- [Google Scholar]
- Comparison of cerebral blood volume and vascular permeability from dynamic susceptibility contrast-enhanced perfusion MR imaging with glioma grade. AJNR Am J Neuroradiol. 2004;25:746-55.
- [Google Scholar]
- Glioma grading: Sensitivity, specificity, and predictive values of perfusion MR imaging and proton MR spectroscopic imaging compared with conventional MR imaging. AJNR Am J Neuroradiol. 2003;24:1989-98.
- [Google Scholar]
- Comparison of dynamic contrast-enhanced MRI with WHO tumor grading for gliomas. Eur Radiol. 2001;11:1231-41.
- [Google Scholar]
- Discriminant analysis to classify glioma grading using dynamic contrast-enhanced MRI and immunohistochemical markers. Neuroradiology. 2012;54:205-13.
- [Google Scholar]
- Dynamic, contrast-enhanced perfusion MRI in mouse gliomas: Correlation with histopathology. Magn Reson Med. 2003;49:848-55.
- [Google Scholar]
- Perfusion MRI: The five most frequently asked technical questions. AJR Am J Roentgenol. 2013;200:24-34.
- [Google Scholar]
- DCE and DSC MR perfusion imaging in the differentiation of recurrent tumour from treatment-related changes in patients with glioma. Clin Radiol. 2014;69:e264-72.
- [Google Scholar]
- Dynamic contrast-enhanced and dynamic susceptibility contrast perfusion MR imaging for glioma grading: Preliminary comparison of vessel compartment and permeability parameters using hotspot and histogram analysis. Eur J Radiol. 2016;85:1147-56.
- [Google Scholar]
- Comparison of microvascular permeability measurements, K (trans), determined with conventional steady-state T1-weighted and first-pass T2*-weighted MR imaging methods in gliomas and meningiomas. AJNR Am J Neuroradiol. 2006;27:409-17.
- [Google Scholar]
- Dynamic contrast-enhanced quantitative perfusion measurement of the brain using T1-weighted MRI at 3T. J Magn Reson Imaging. 2008;27:754-62.
- [Google Scholar]
- Quantification of cerebral blood flow, cerebral blood volume, and blood-brain-barrier leakage with DCE-MRI. Magn Reson Med. 2009;62:205-17.
- [Google Scholar]
- Quantification of physiological and hemodynamic indices using T1 dynamic contrast-enhanced MRI in intracranial mass lesions. J Magn Reson Imaging. 2007;26:871-80.
- [Google Scholar]
- High resolution measurement of cerebral blood flow using intravascular tracer bolus passages. Part I: Mathematical approach and statistical analysis. Magn Reson Med. 1996;36:715-25.
- [Google Scholar]
- Statistical methods for assessing agreement between two methods of clinical measurement. Lancet. 1986;1:307-10.
- [Google Scholar]
- Correlation and agreement: Overview and clarification of competing concepts and measures. Shanghai Arch Psychiatry. 2016;28:115-20.
- [Google Scholar]
- Bayesian estimation of cerebral perfusion using reduced-contrast-dose dynamic susceptibility contrast perfusion at 3T. AJNR Am J Neuroradiol. 2015;36:710-8.
- [Google Scholar]
- Measurement of brain perfusion, blood volume, and blood-brain barrier permeability, using dynamic contrast-enhanced T1-weighted MRI at 3 tesla. Magn Reson Med. 2009;62:1270-81.
- [Google Scholar]
- Measurement of cerebral blood volume in humans using hyperoxic MRI contrast. J Magn Reson Imaging. 2007;26:894-9.
- [Google Scholar]
- Quantitative CBV measurement from static T1 changes in tissue and correction for intravascular water exchange. Magn Reson Med. 2006;56:138-45.
- [Google Scholar]
- Database of normal human cerebral blood flow, cerebral blood volume, cerebral oxygen extraction fraction and cerebral metabolic rate of oxygen measured by positron emission tomography with 15O-labelled carbon dioxide or water, carbon monoxide and oxygen: A multicentre study in Japan. Eur J Nucl Med Mol Imaging. 2004;31:635-43.
- [Google Scholar]
- Correction for the presence of intravascular oxygen-15 in the steady-state technique for measuring regional oxygen extraction ratio in the brain: 1. Description of the method. J Cereb Blood Flow Metab. 1983;3:416-24.
- [Google Scholar]
- Comparison of cerebral blood volume maps generated from T2* and T1 weighted MRI data in intra-axial cerebral tumours. Br J Radiol. 2007;80:161-8.
- [Google Scholar]